From correlation to regression

Statistics and Data Science II · Week 1

Jesper Lindmarker

Today

In the lecture

  1. Drawing our assumptions about a causal structure
  2. How that shows us why two things might be correlated
  3. Why a regression is a prediction
  4. Why a regression is an equation
  5. How to interpret an intercept and a coefficient from regression output

In the lab

  1. What I consider a poor lab report, and a sufficient one
  2. Describing a dataset
  3. Fitting a regression
  4. Working on the lab
  5. Fixing bugs in your R setup

Is studying for SDS-I worth it?

Is studying worth it?

Let’s imagine a dataset:

  • Where we have gathered the exam results from all SDS-I students the past 10 years
  • We have asked them how many hours they studied for the exam
  • And we gathered some other information about them.

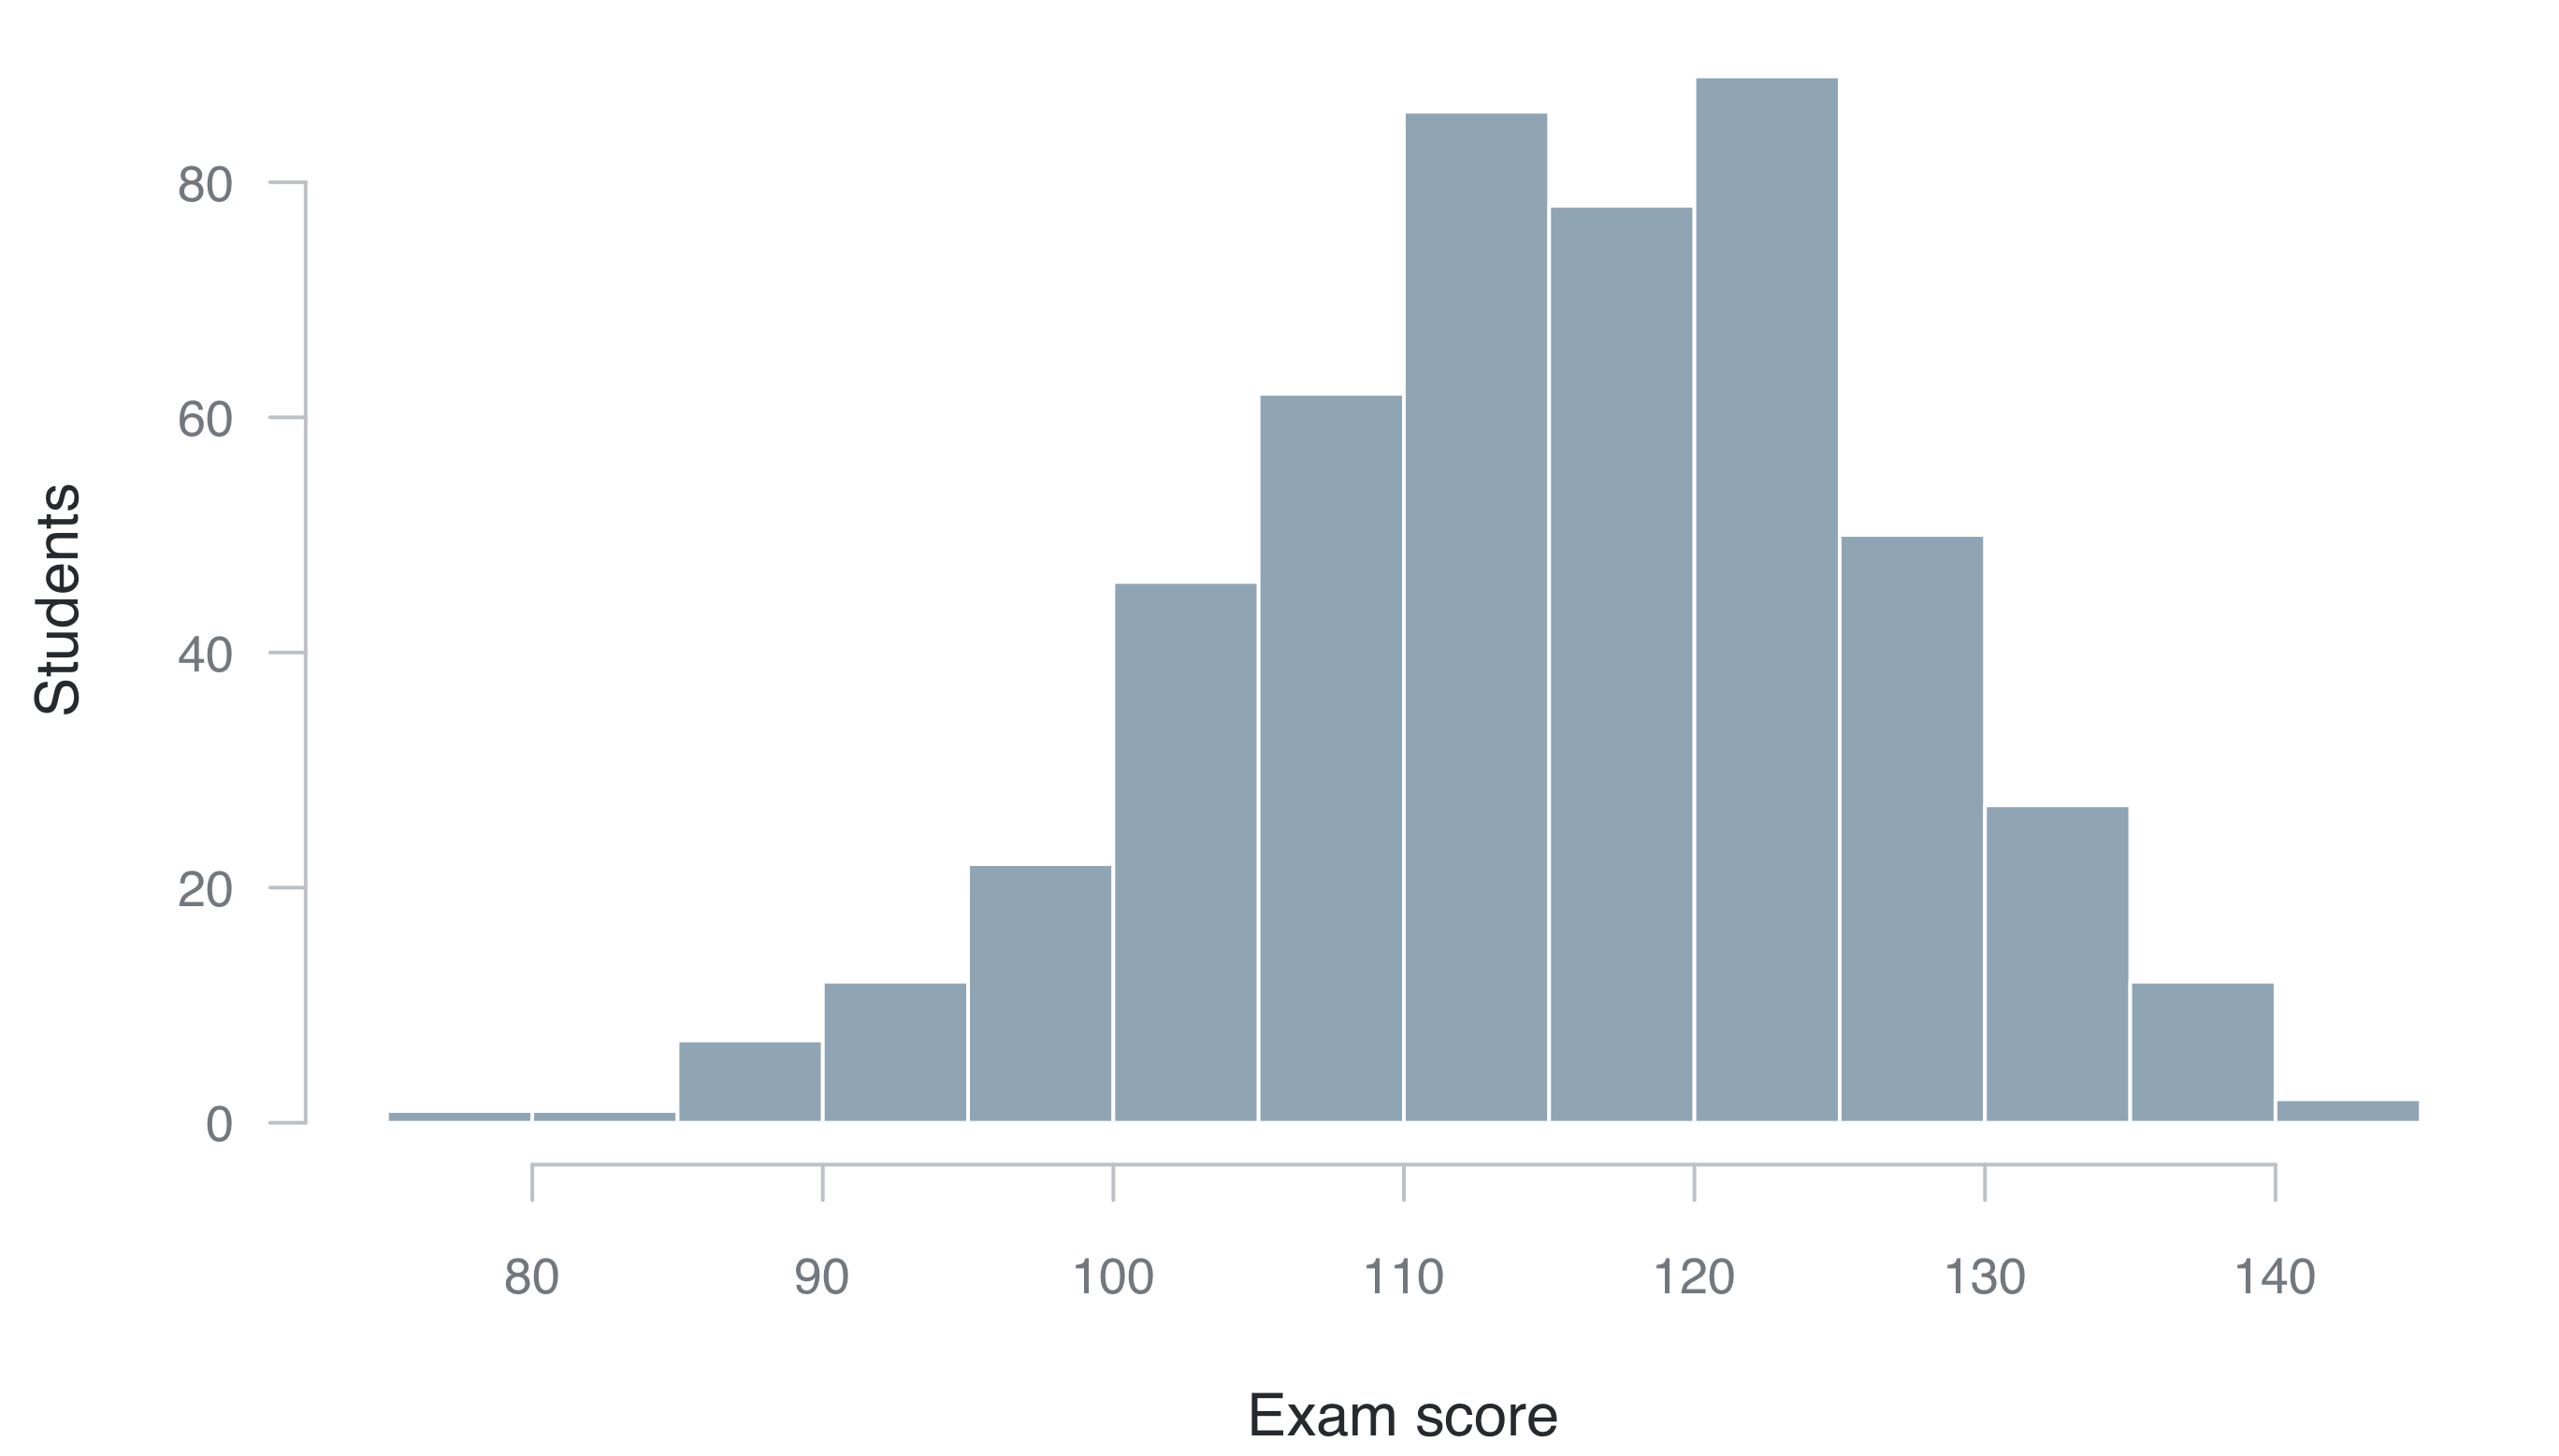
Variation in exam score

Why did some students score higher than others? ie. why is there variation?

Correlation
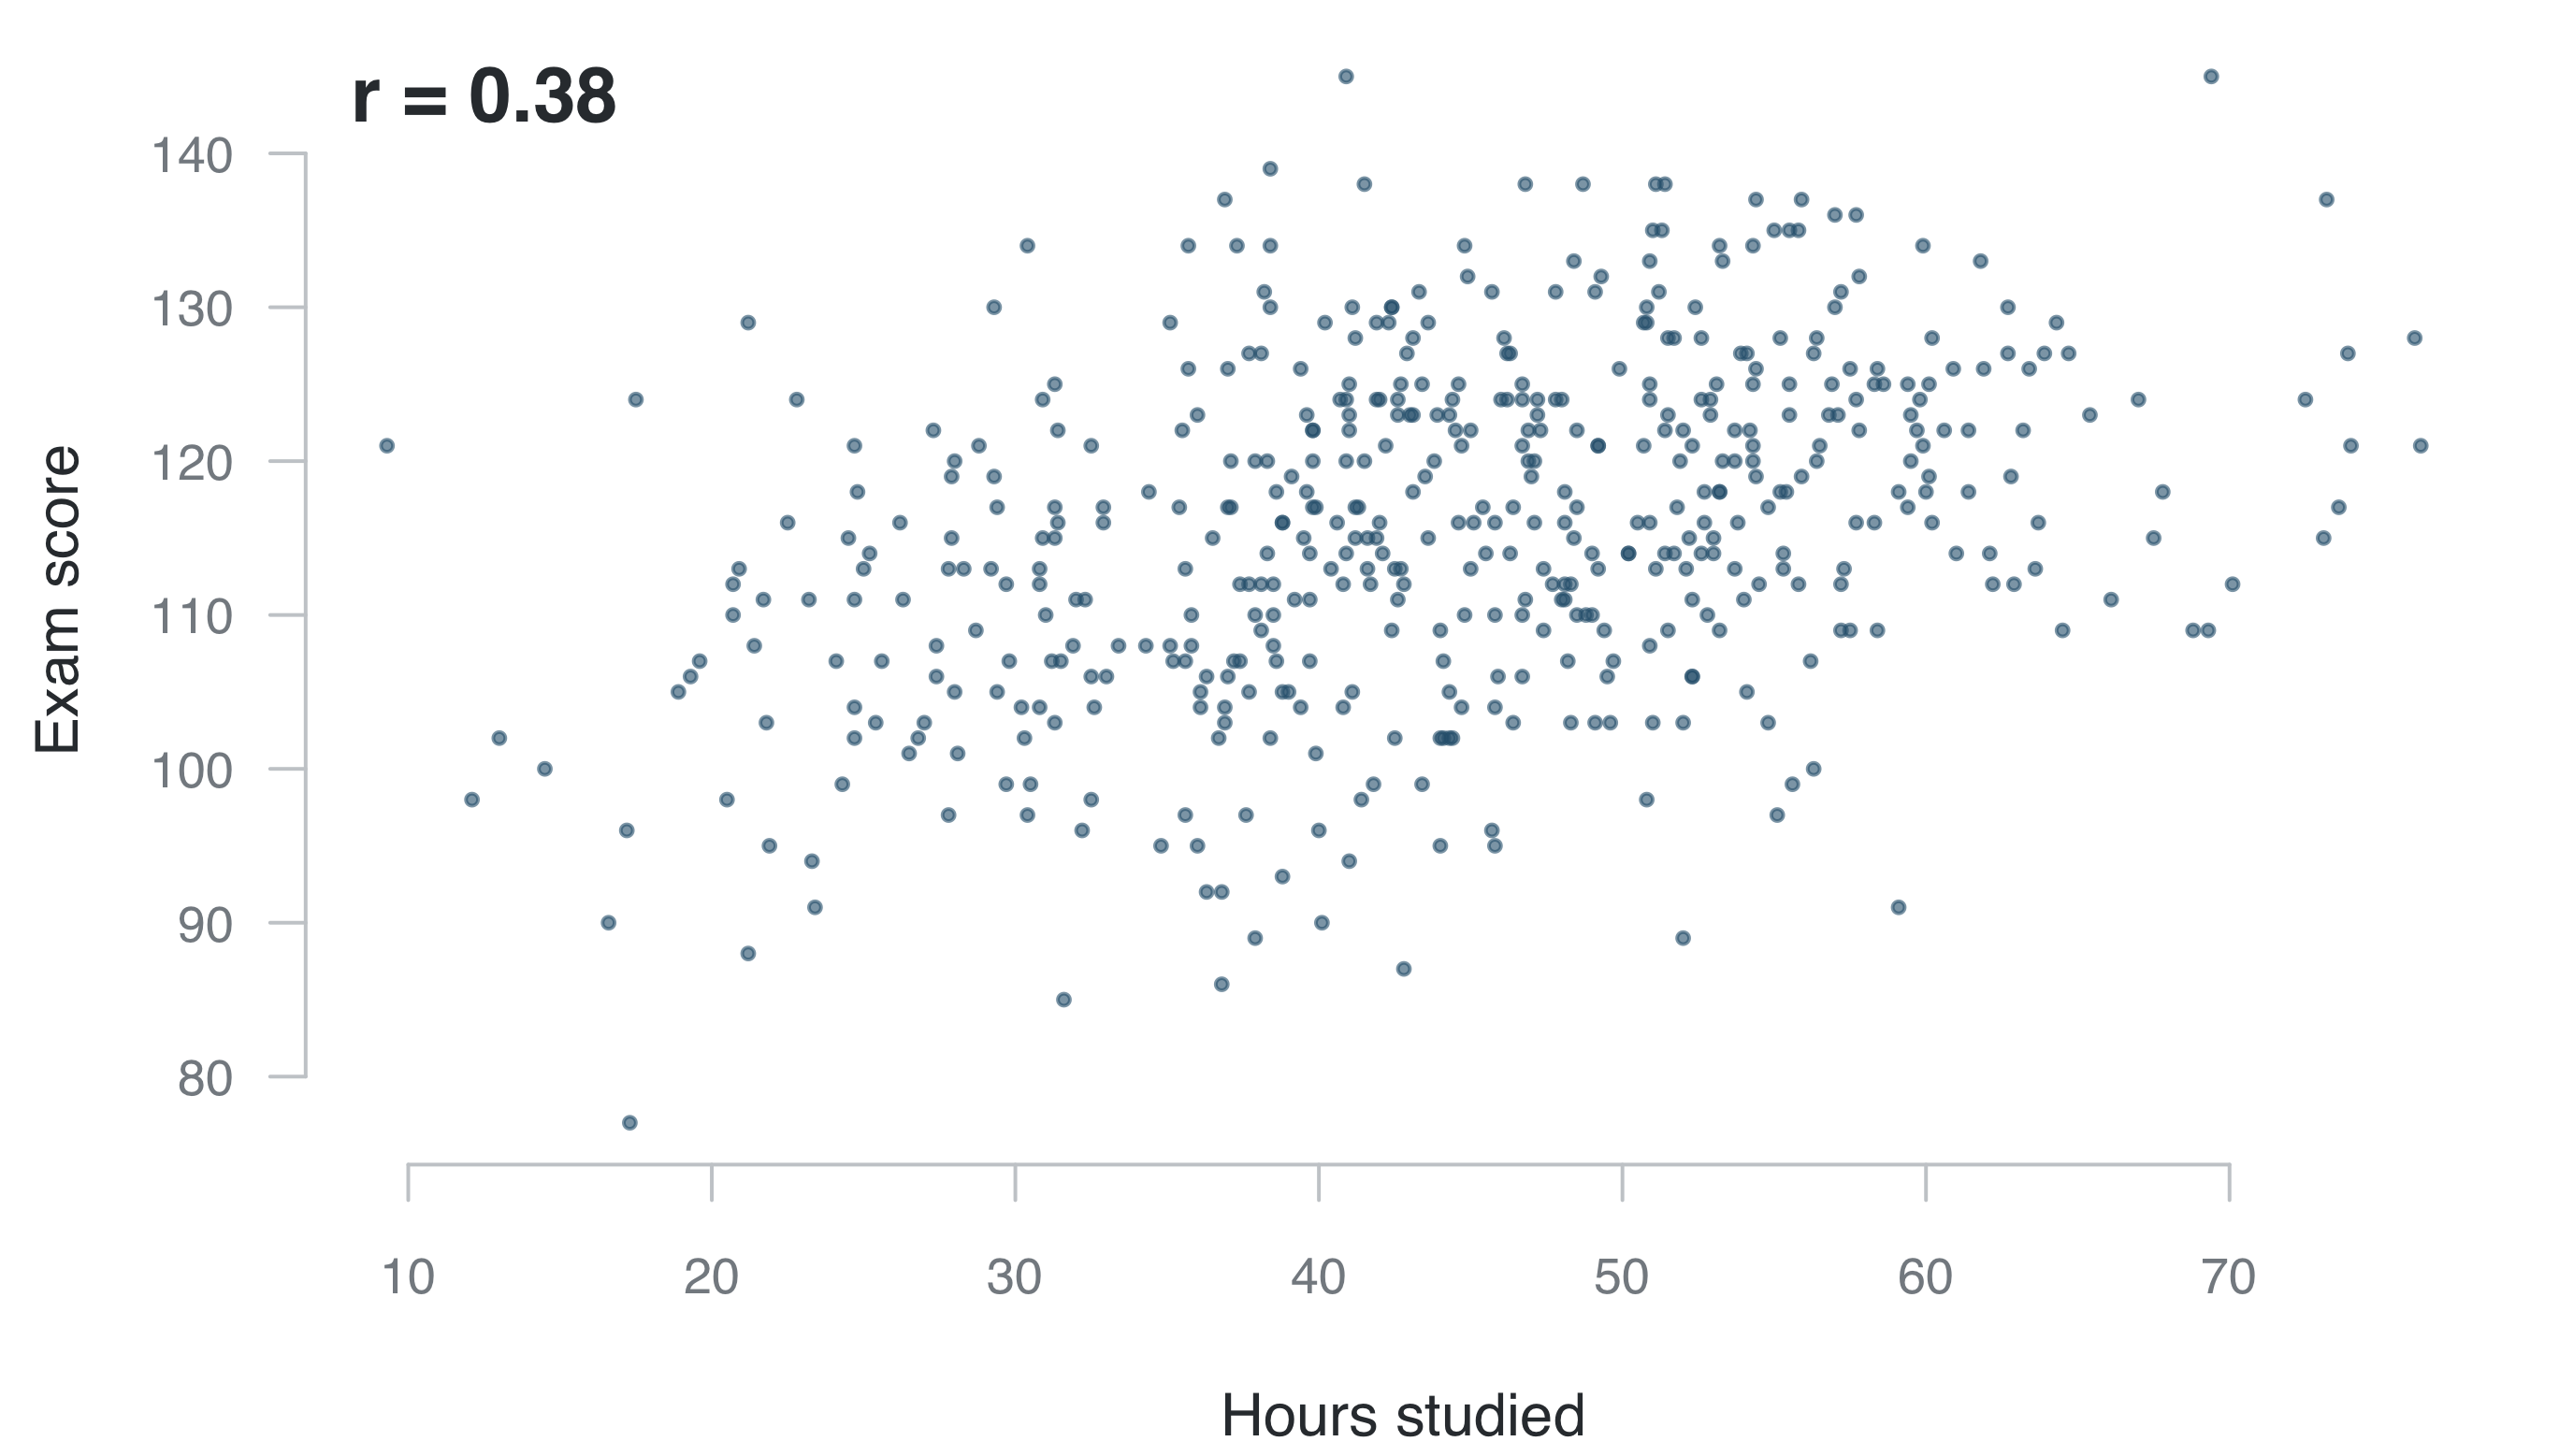
Exam score varies with is how long each student studied.

Draw your assumptions

Exercise

  • Task: on paper, draw everything that you think influences hours studied, exam score, or both.
  • Nodes and directed edges: A node for each thing (variable), an edge from whatever affects it.

We do this for 4 minutes. The phrase is Miguel Hernán’s: draw your assumptions before your conclusions.

Nodes and edges

%%{init: {"theme":"base","themeVariables":{"fontFamily":"Source Sans 3, sans-serif","fontSize":"20px","primaryColor":"#ffffff","primaryTextColor":"#33383d","primaryBorderColor":"#858b91","lineColor":"#9aa0a6"},"flowchart":{"curve":"basis","nodeSpacing":12,"rankSpacing":140,"padding":6}}}%%
flowchart LR
  A --> X
  A --> Y
  B --> X
  C --> X
  C --> J 
  D --> A
  D --> C
  E --> Y
  F --> E
  F --> B
  G --> X
  G --> Y
  H --> C
  I --> Y
  X --> Y
  Y --> J
  classDef main fill:#ffffff,stroke:#33383d,stroke-width:2.6px,color:#17181a;
  classDef other fill:#ffffff,stroke:#c9ccd0,stroke-width:1.4px,color:#858b91;
  class X,Y main;
  class A,B,C,D,E,F,G,H,I,J other;

A node is anything that can affect something else. An edge means that changing the node it starts from would change the one it points to. X is hours studied, Y is exam score.

Now draw yours: everything that you think influences hours studied, exam score, or both.

What did you draw?

  • Drawing you assumptions can help understand why things are correlated.
  • Hernan and Robins (2020) call this a causal diagram.

In reality, social questions, and most other questions too, are messy system of causes and effects.

Six common reasons things correlate

# Reason Why that shows up as a correlation
1 X causes Y Change X and Y follows, so the two move together
2 Y causes X Change Y and X follows, so the two move together
3 Something else causes both A third thing moves both at once
4 Who is in the data? Selection into the sample leaves a pattern among those included
5 How it was measured The measurements move together even when they in reality do not
6 Chance, or too small to matter In any finite sample, two unrelated things still show something

From correlation to a line

The limits of a correlation

  • No units. r = 0.38 has no straight forward interpretation. It cannot say how many points an extra hour is worth.
  • The same both ways round. The correlation of hours with score is the same number as the correlation of score with hours.

Regression as prediction

  • What is prediction?
  • A regression is a predictive model.
  • Give it an \(x\), and it hands back a prediction of \(y\).
  • It will do that more or less well.

What we call them

  • The thing we are predicting is the outcome, often called the dependent variable. We write it \(y\)
  • What we predict it from is a predictor, often called an independent variable. We write it \(x\)
  • Here \(y\) is the exam score, and \(x\) is hours studied

A toy example

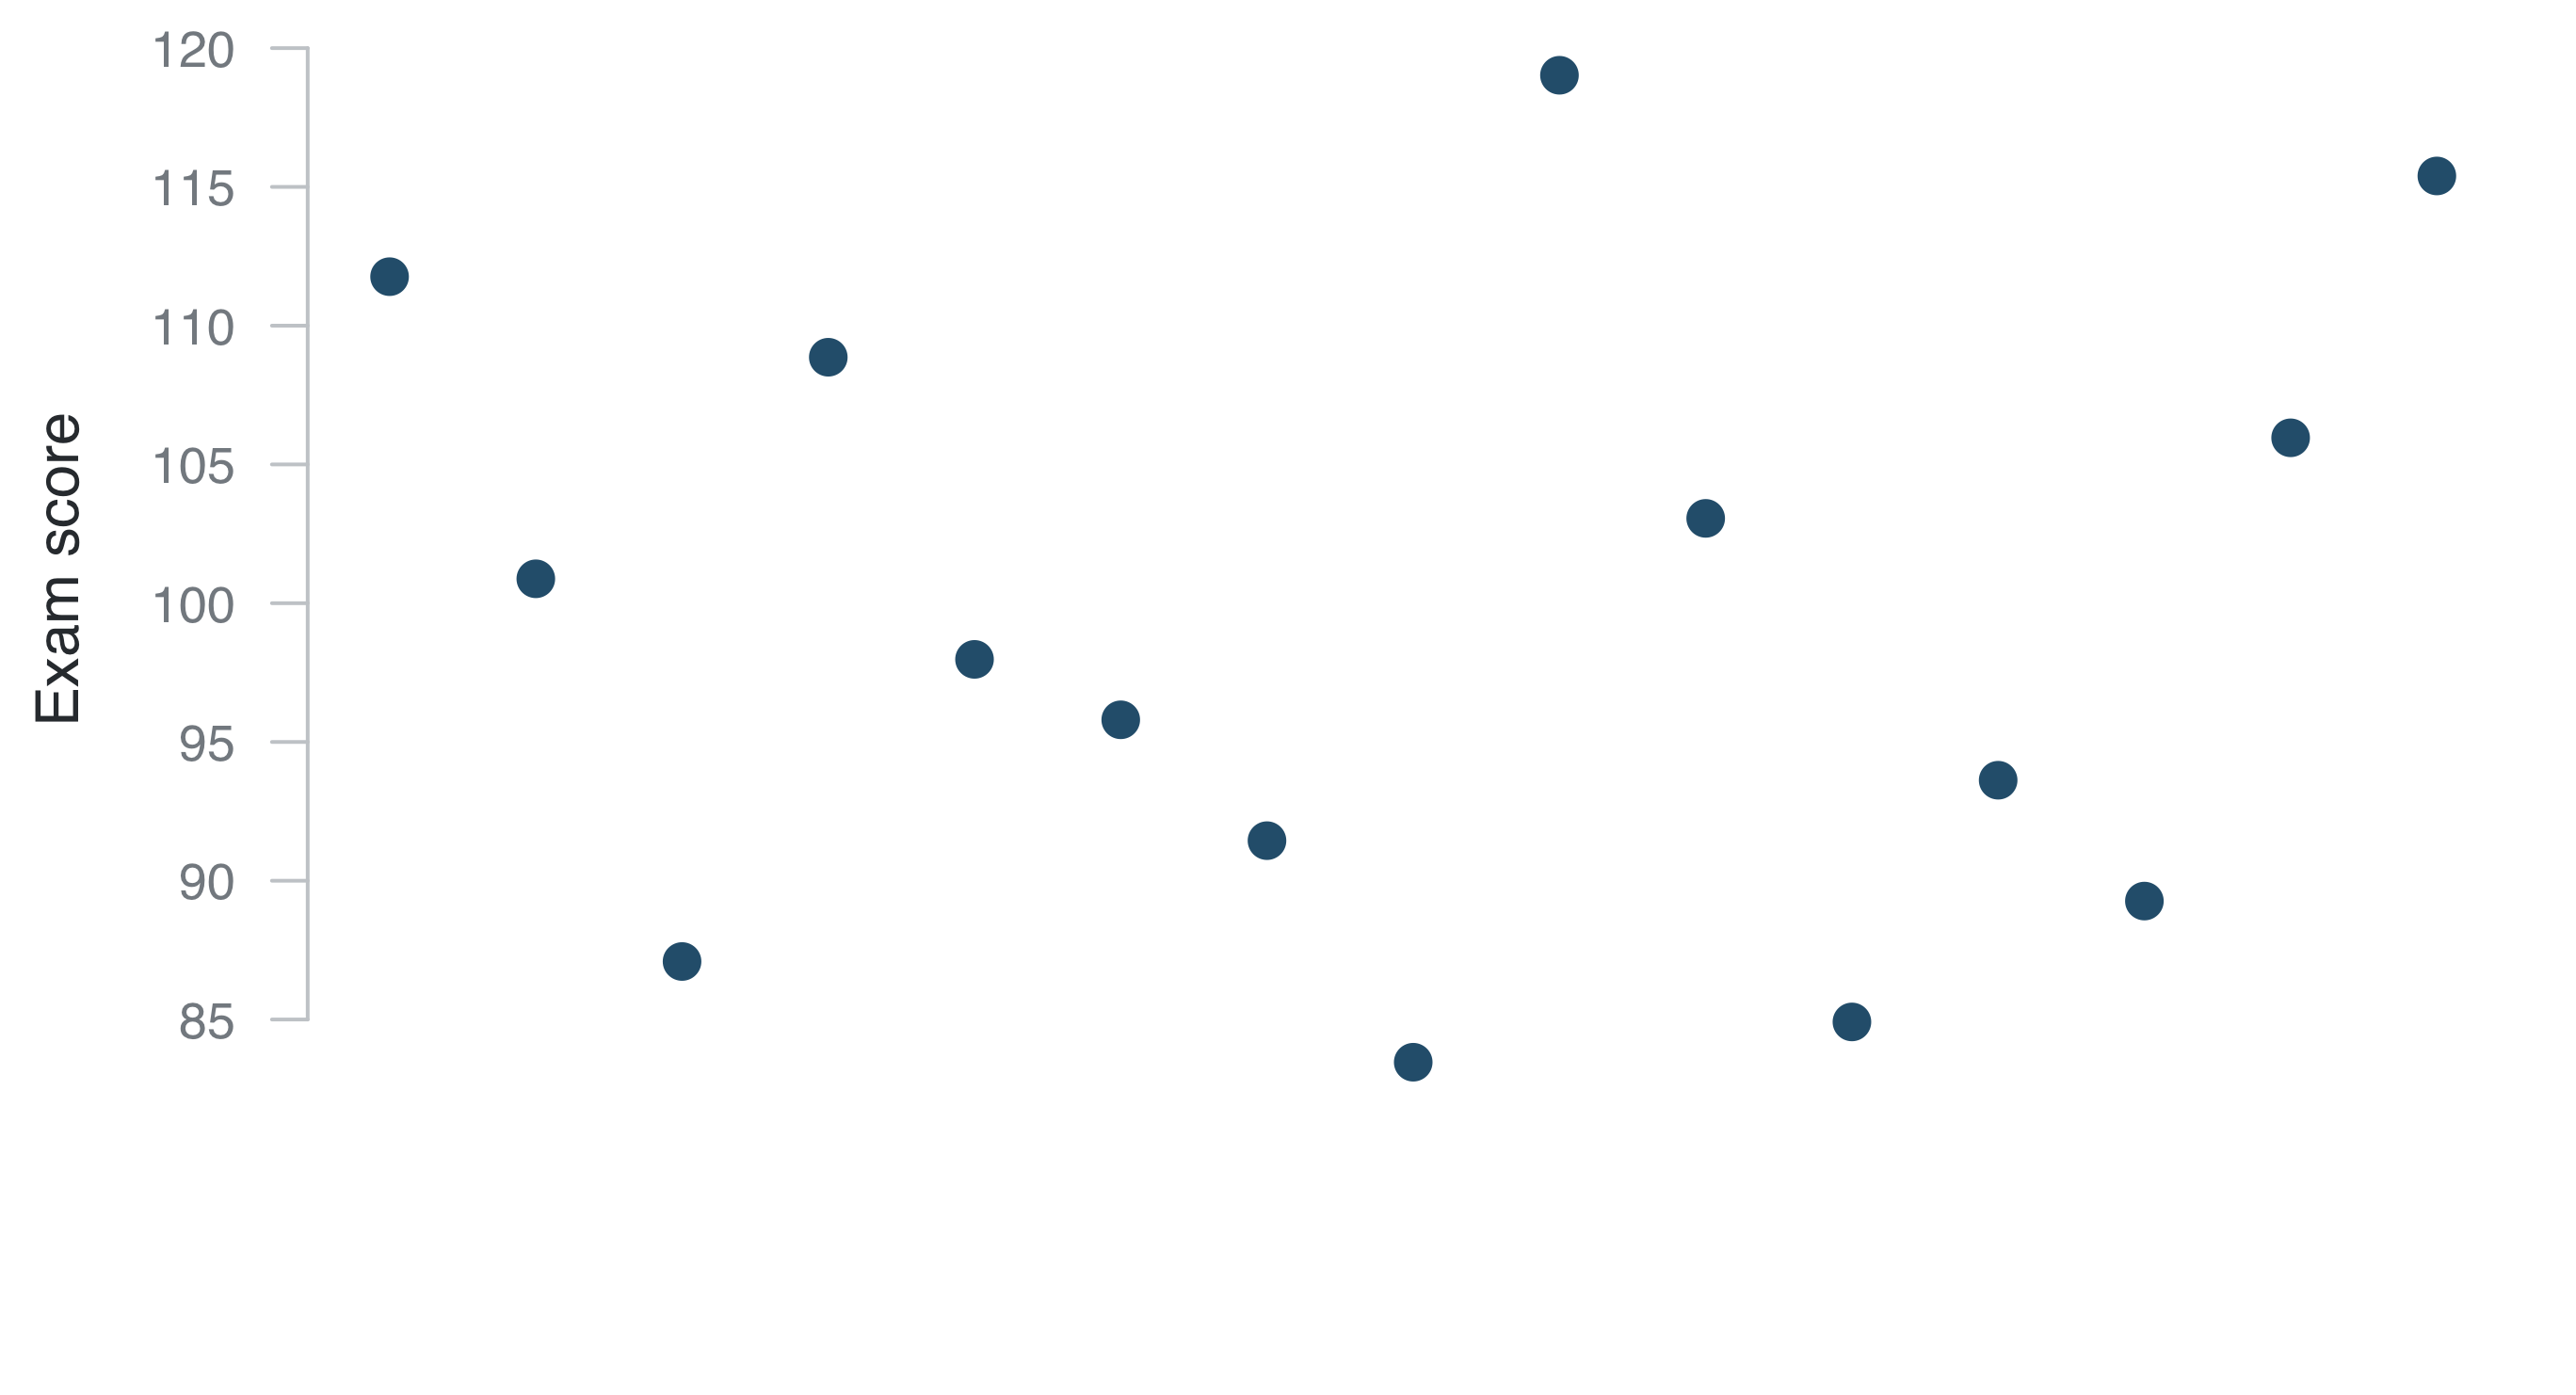
Fifteen students only…

Predict y

Given this data, what is our best prediction of a new \(y_i\)?

Predict y
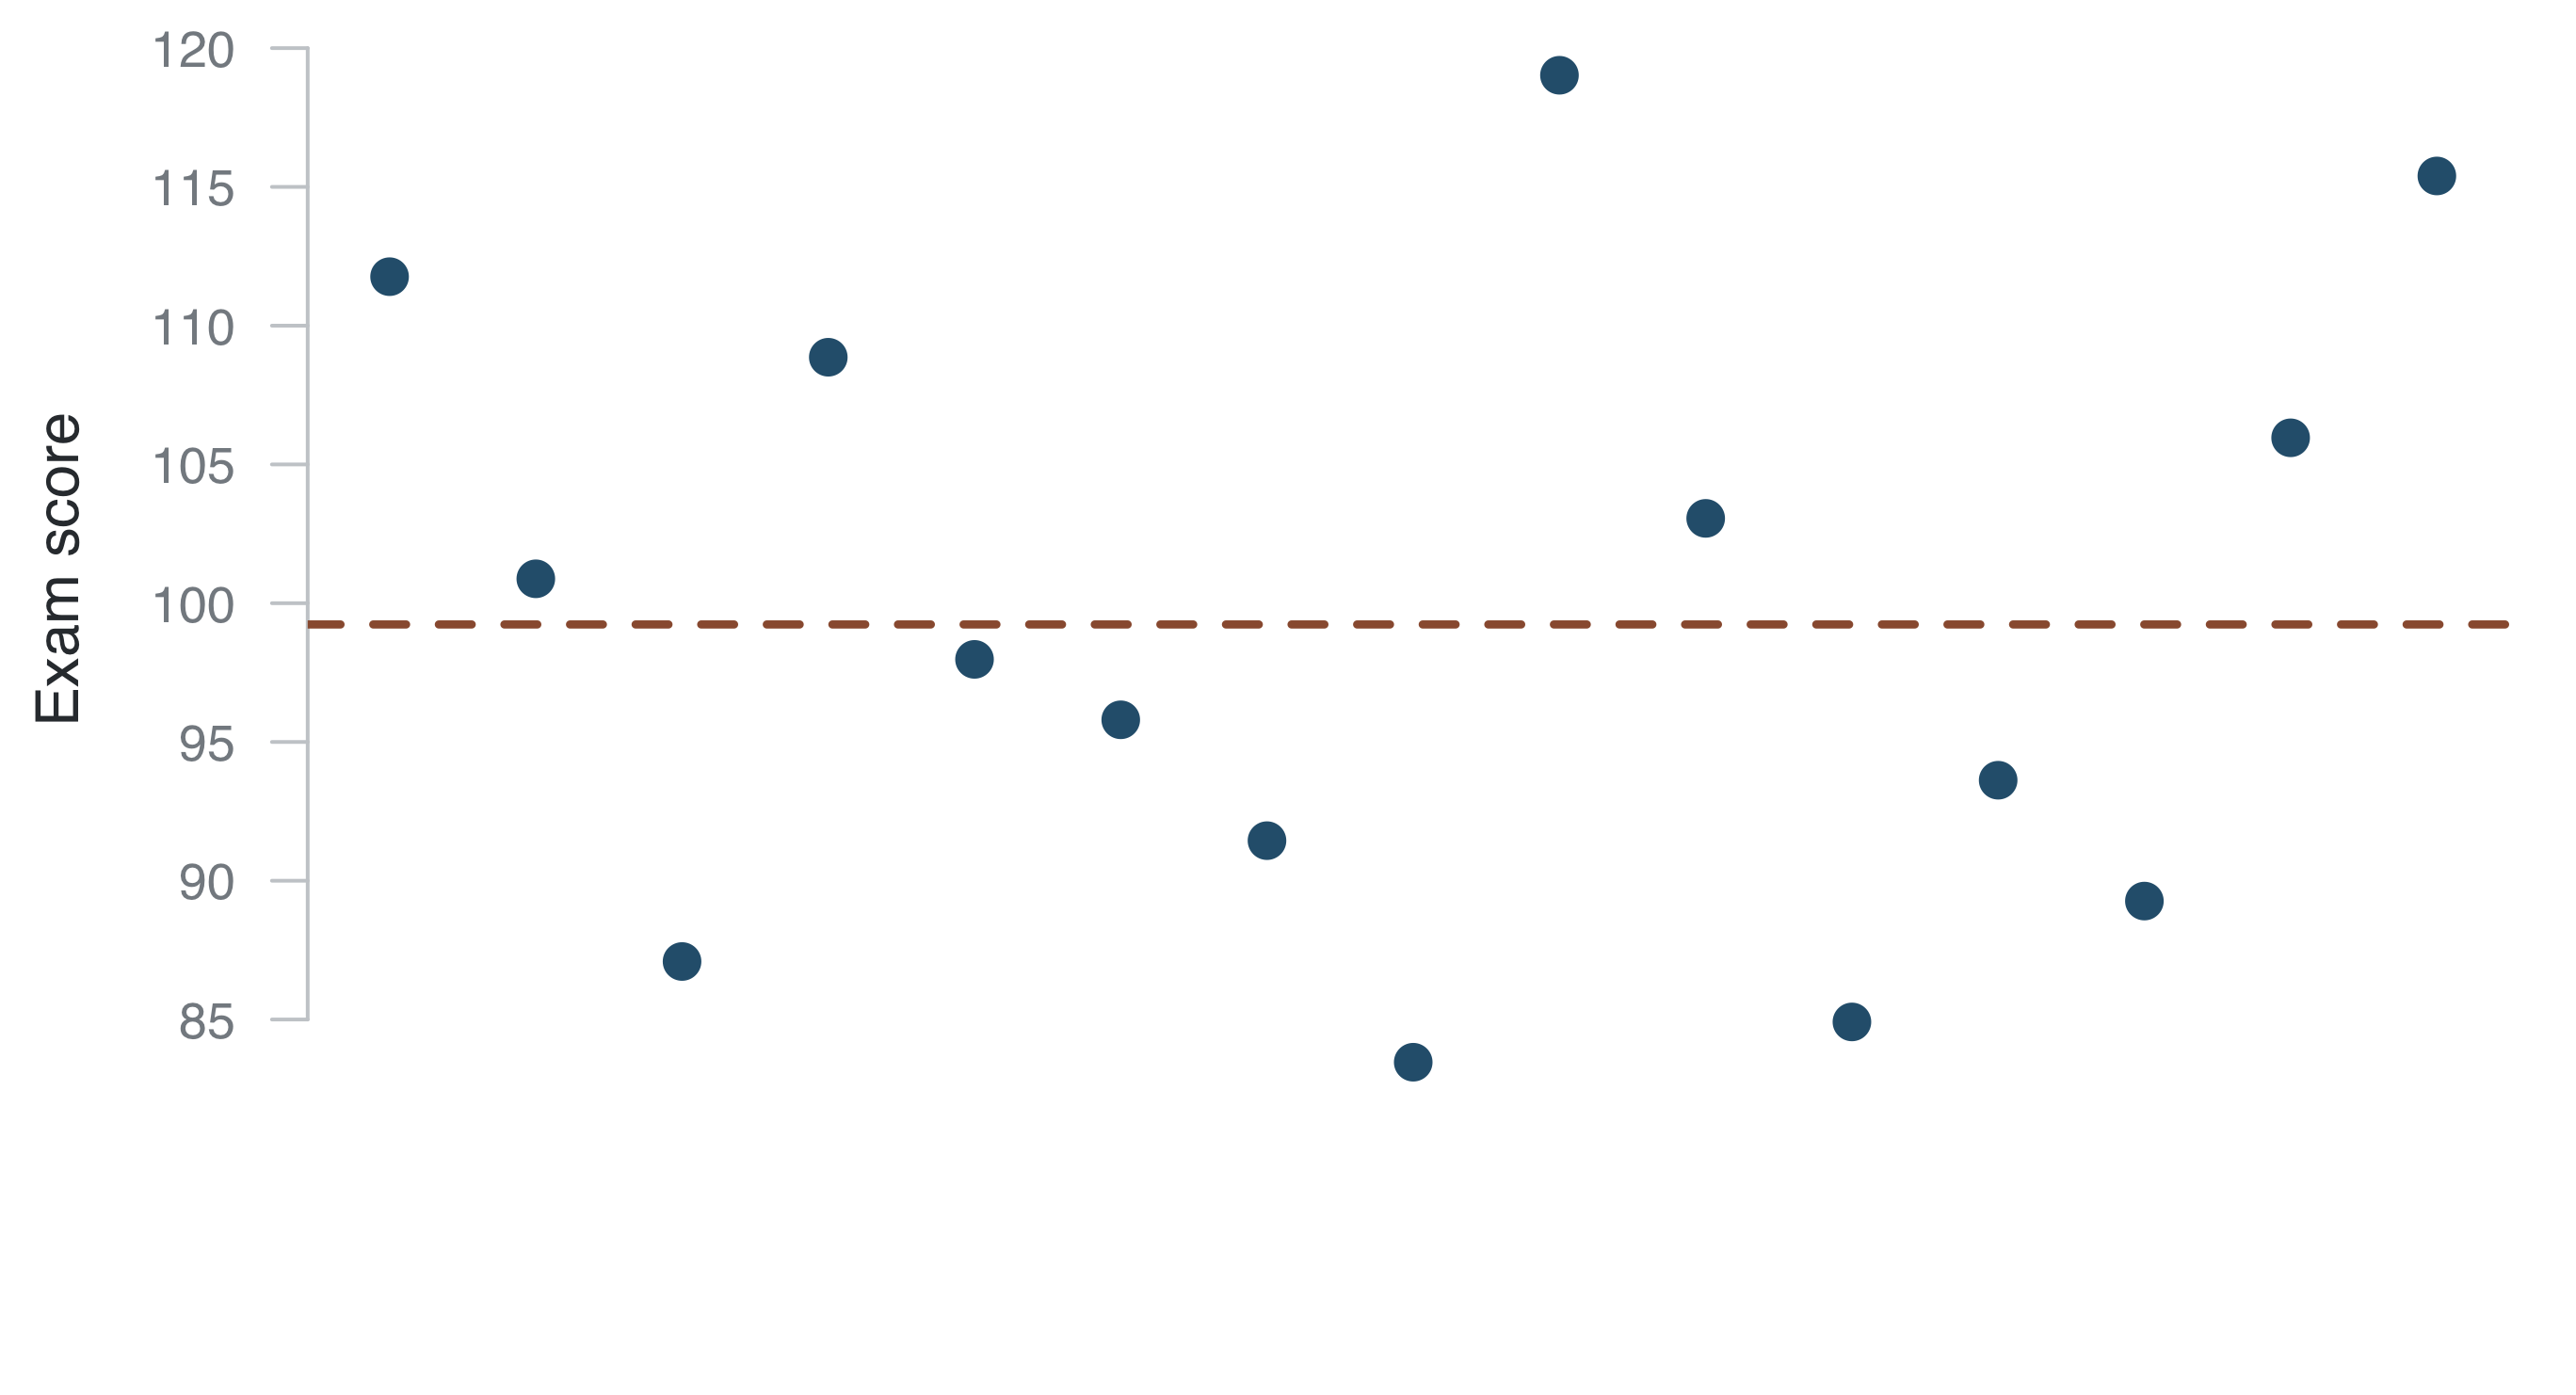
The best prediction for a new \(y\) is the mean: \(\widehat y = \bar y\).

Predict y
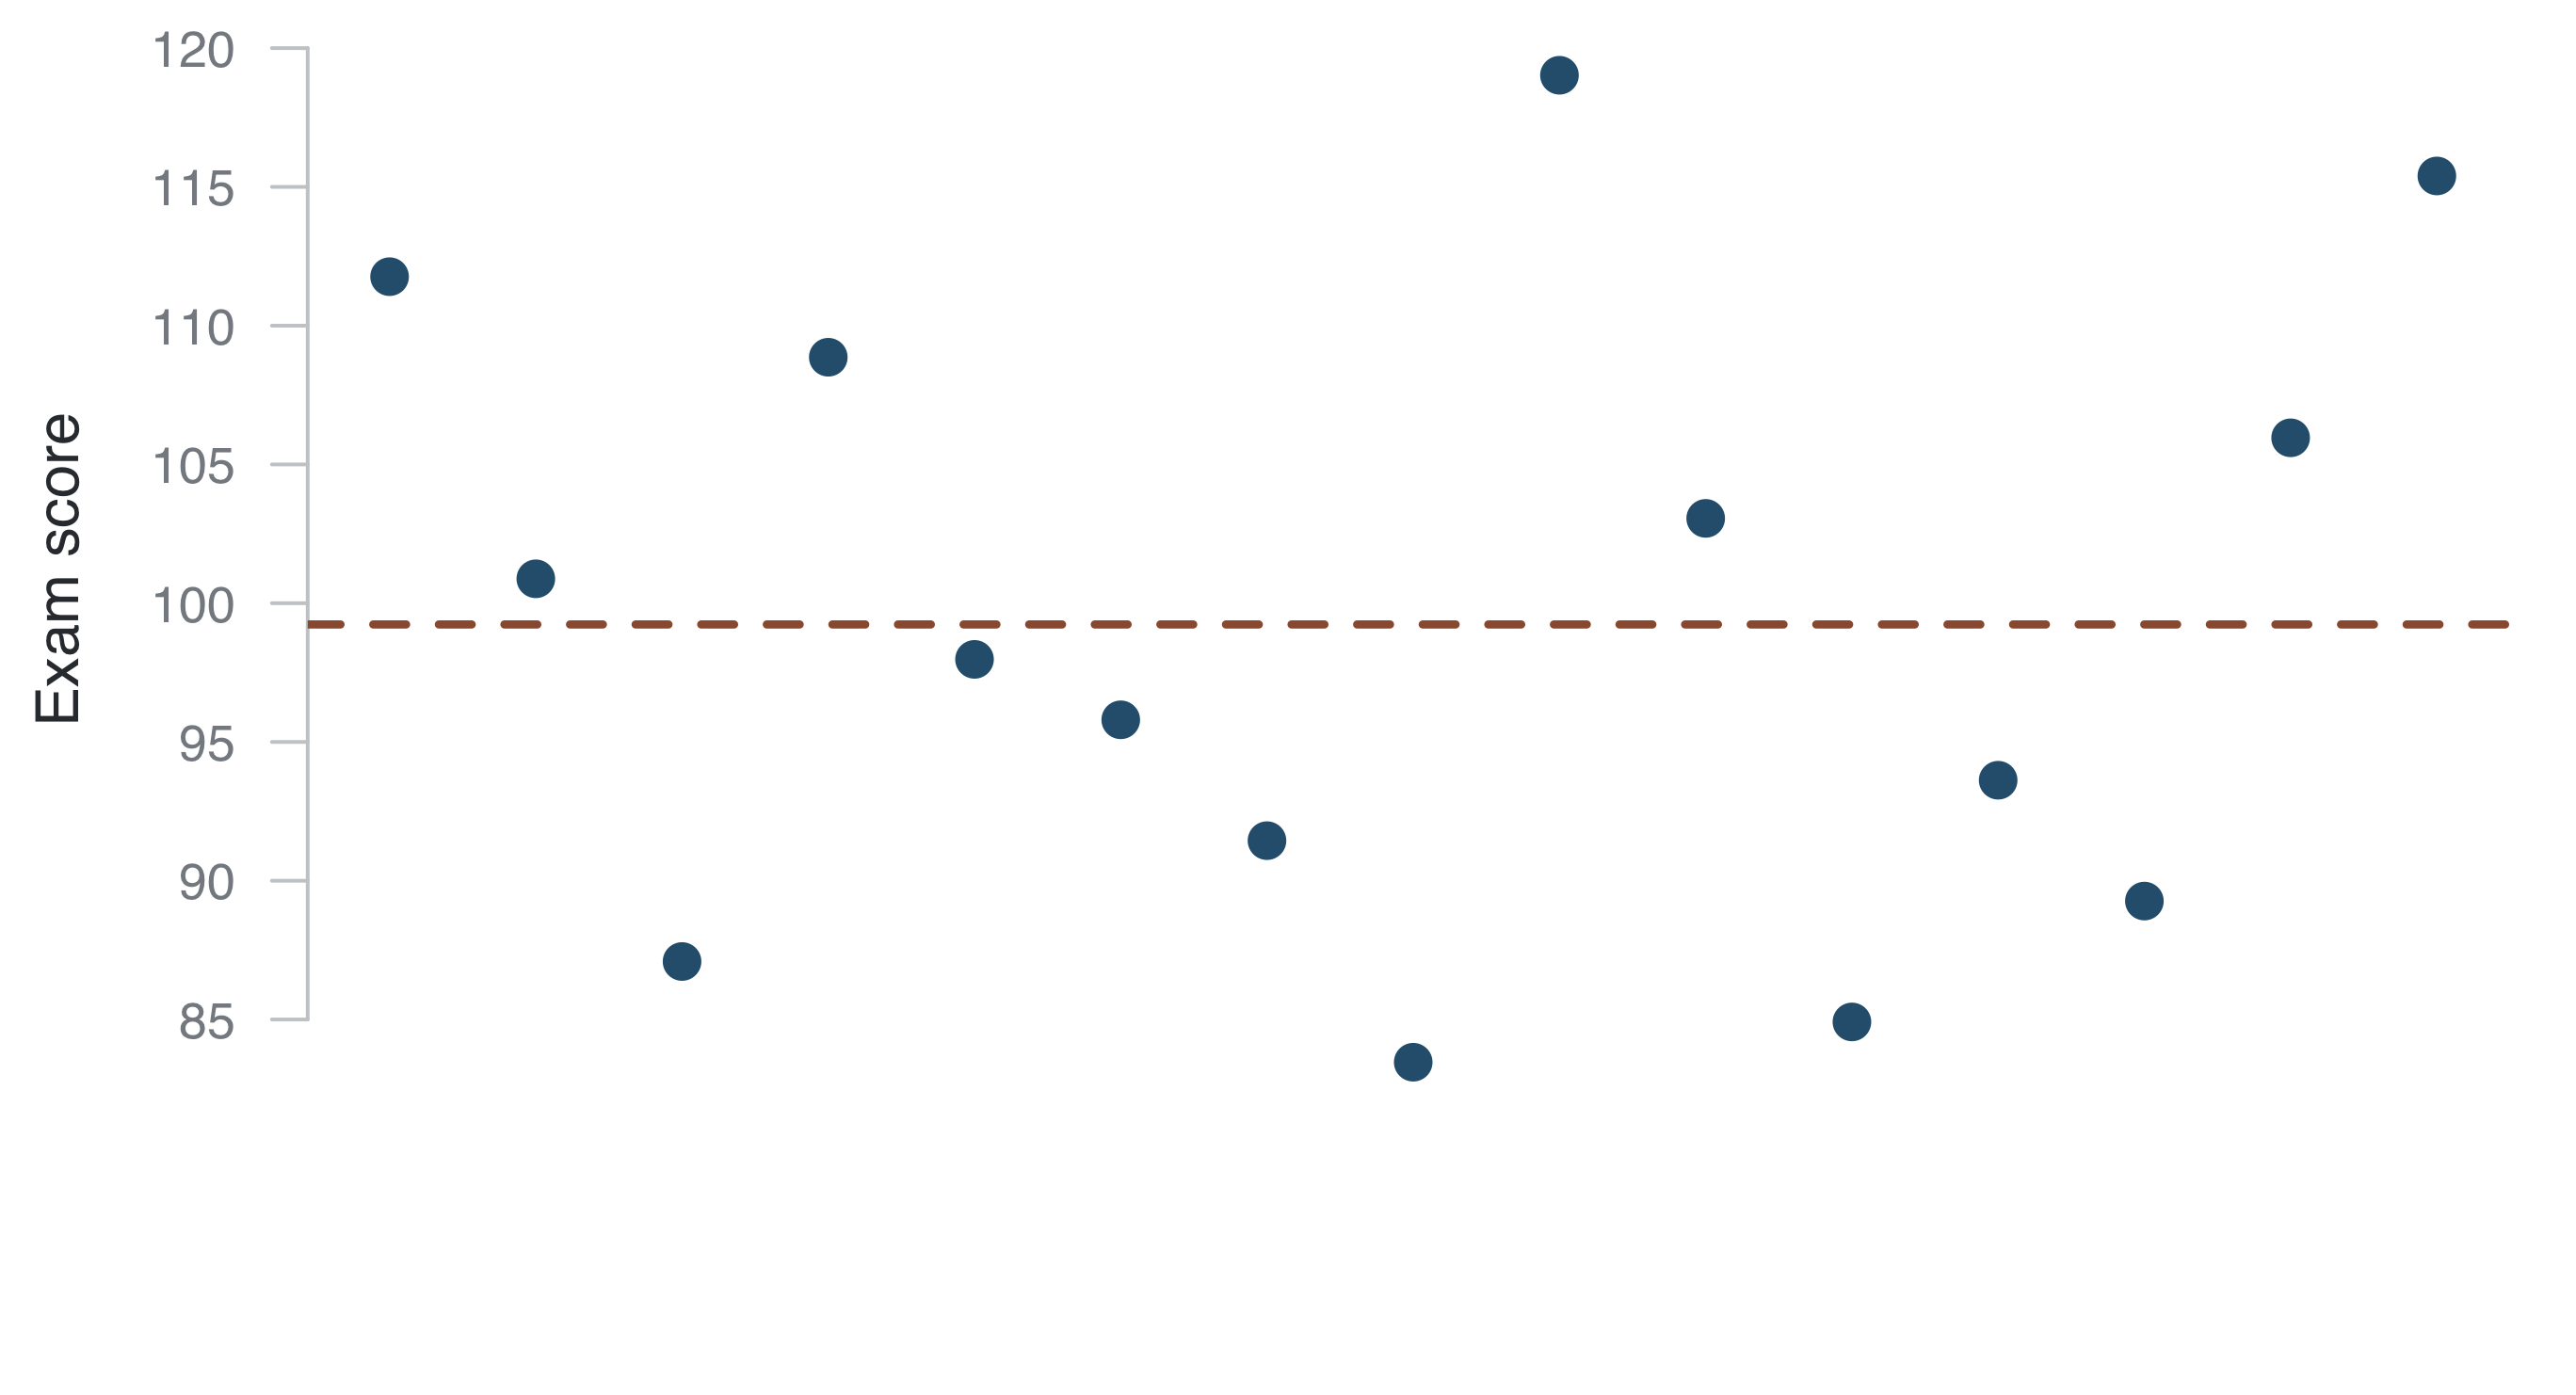
So how “wrong” would we be if we had predicted \(\bar y\) for every \(y_i\)?

Predict y
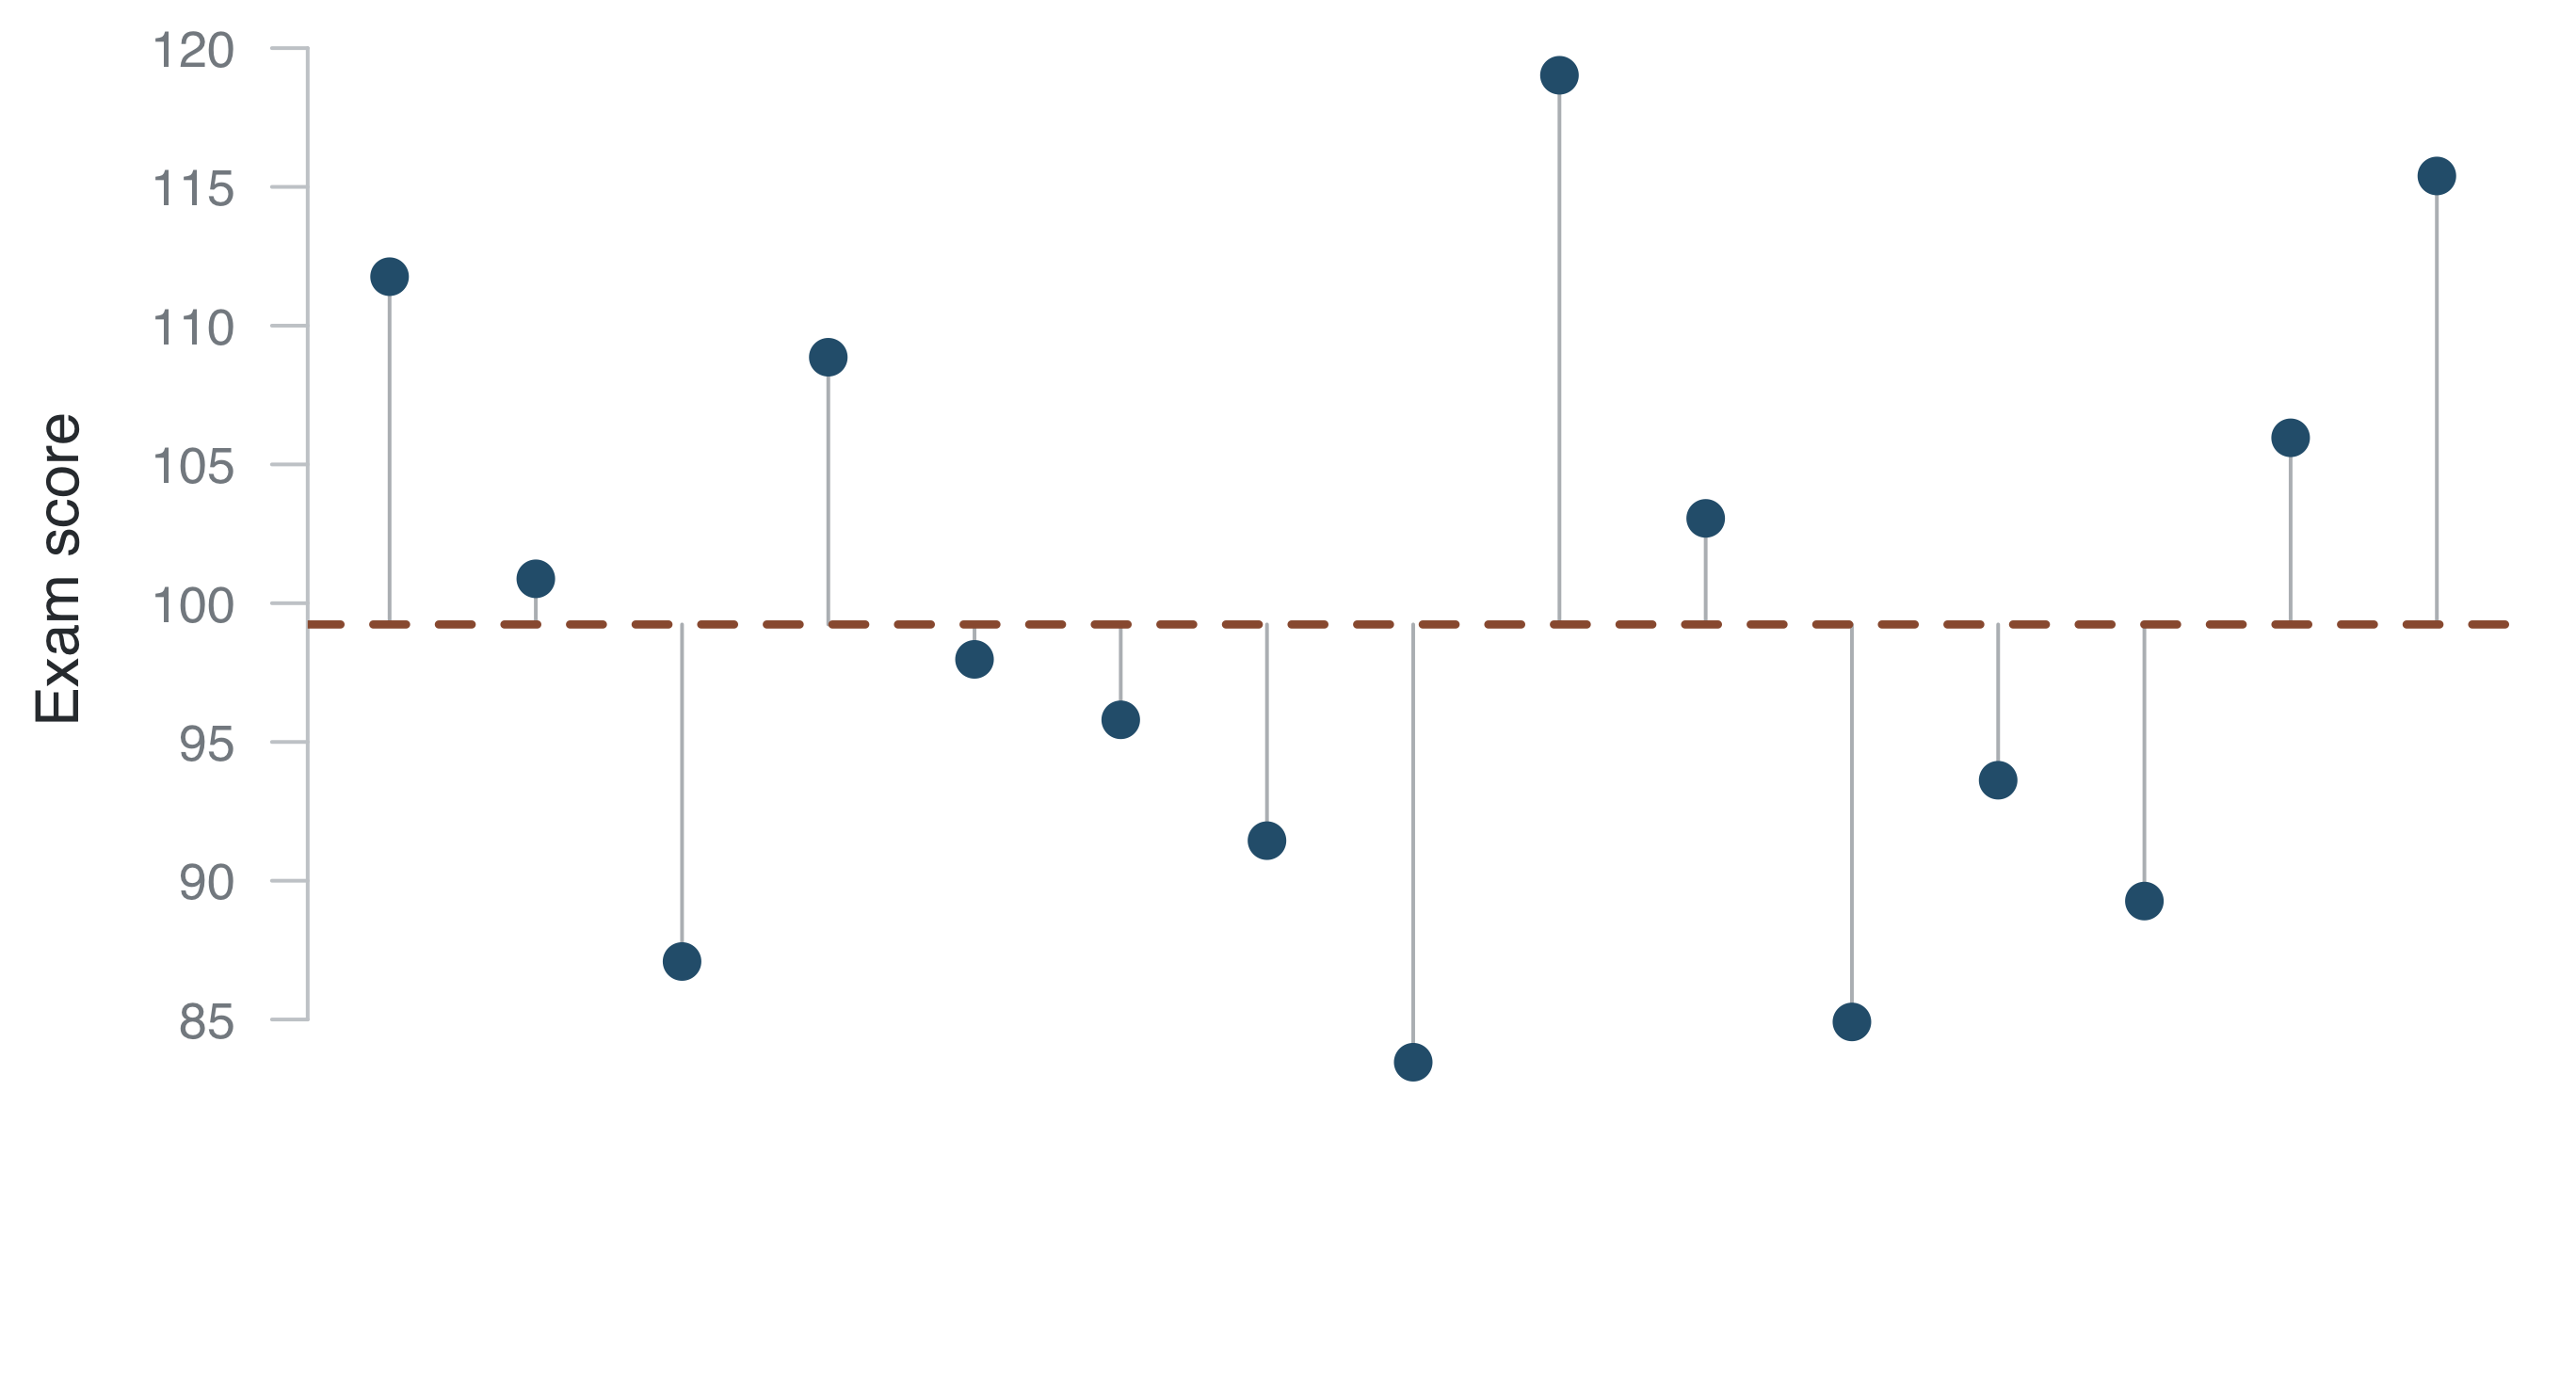
These “errors” are called residuals: \(r_i = y_i - \widehat y_i\).

Predict y
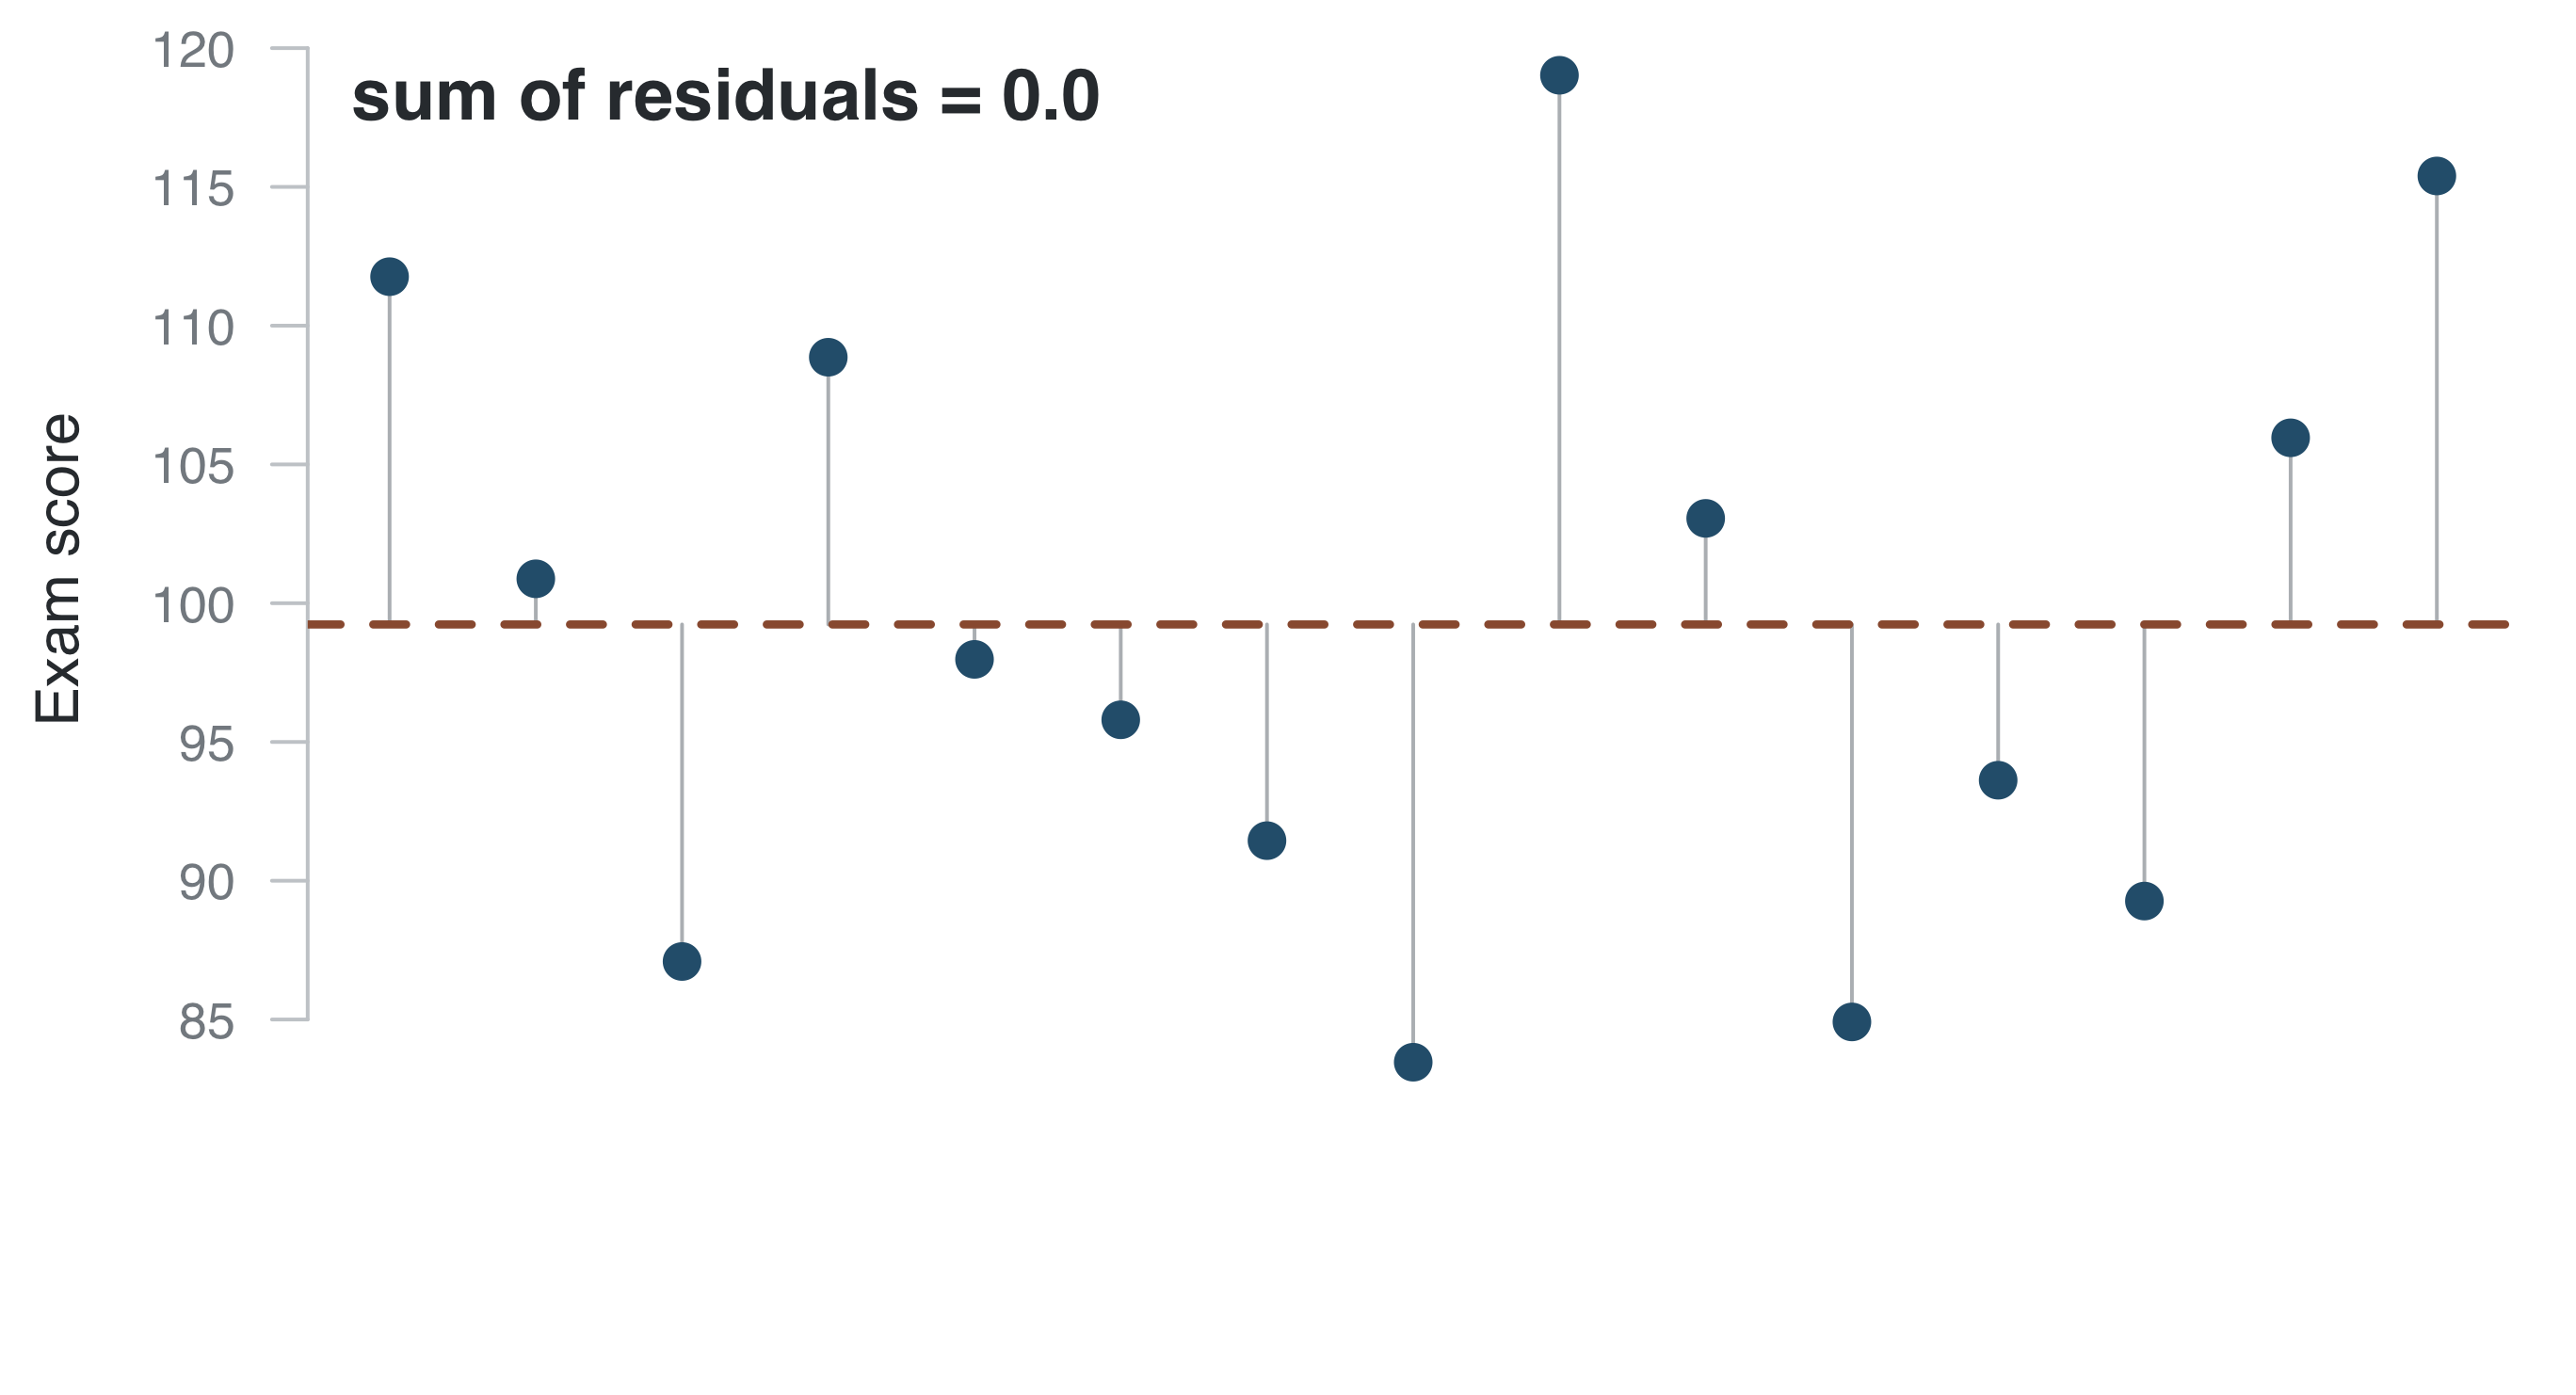
Could we add them up, \(\sum r_i\)? No: the ones above the line cancel the ones below.

Predict y
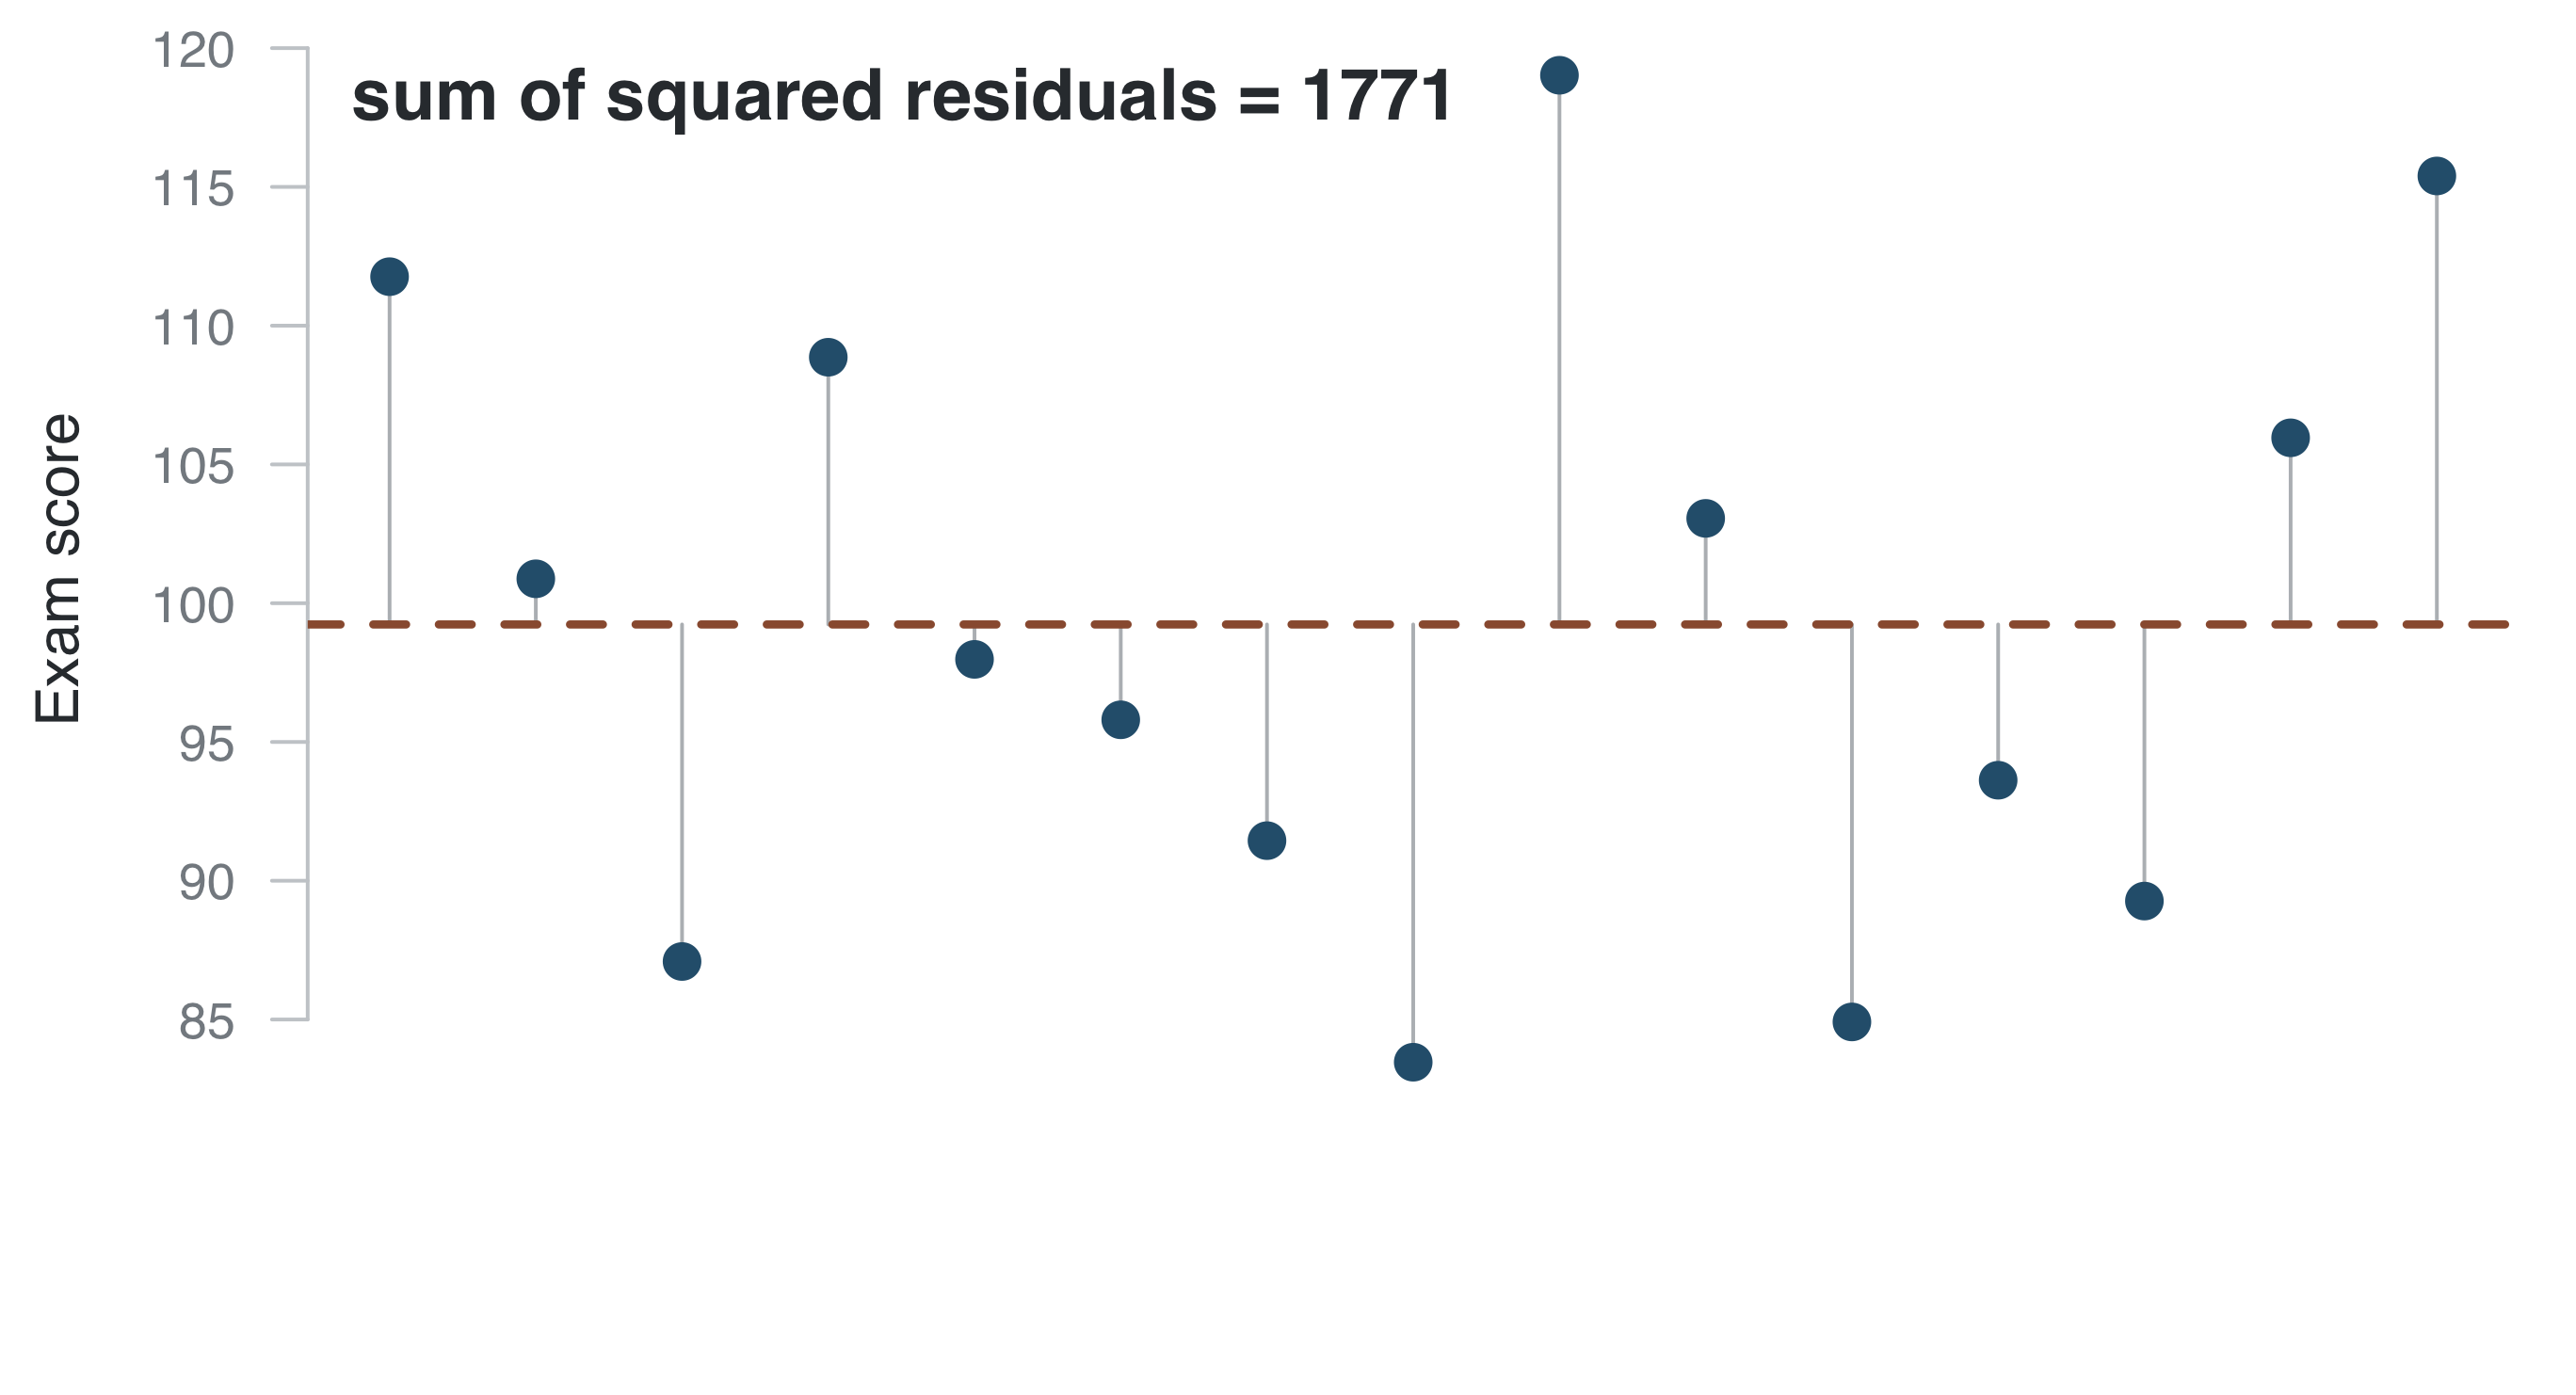
Square them first, \(r_i^2\), then add: one number for how wrong the line is, \(\sum r_i^2\).

Predict y
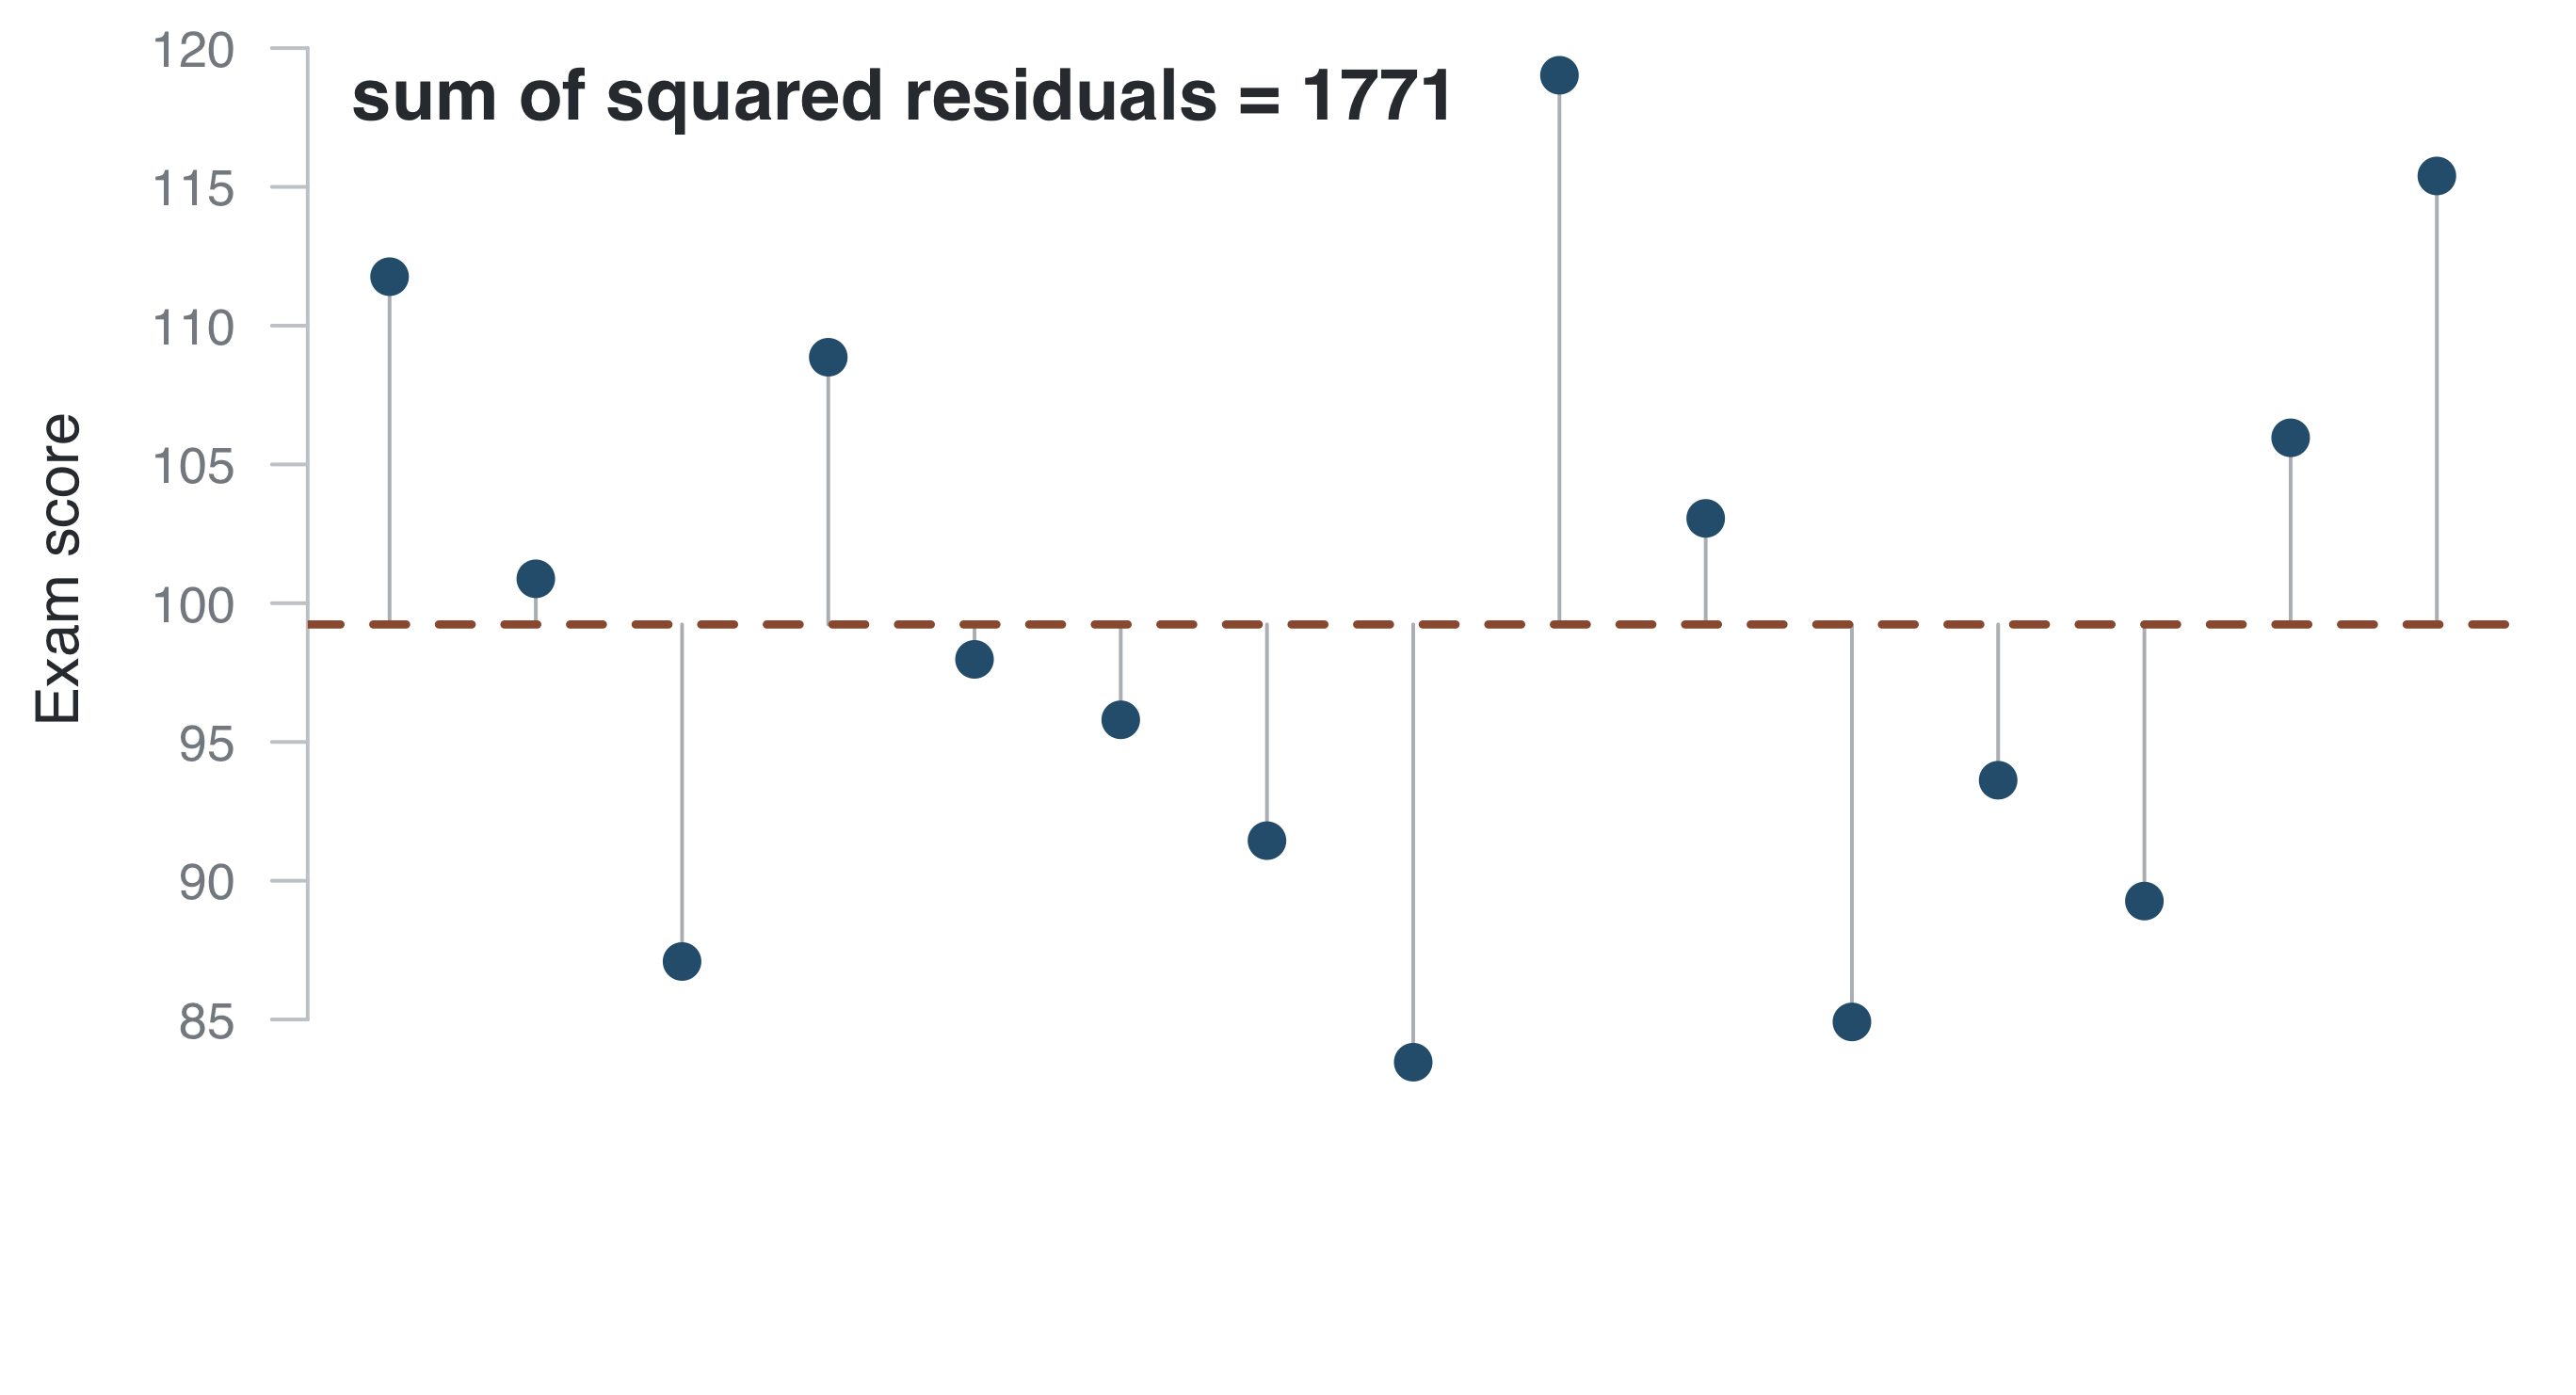
Given no other information, guessing \(\bar y\) makes that number as small as it can be.

Predict y
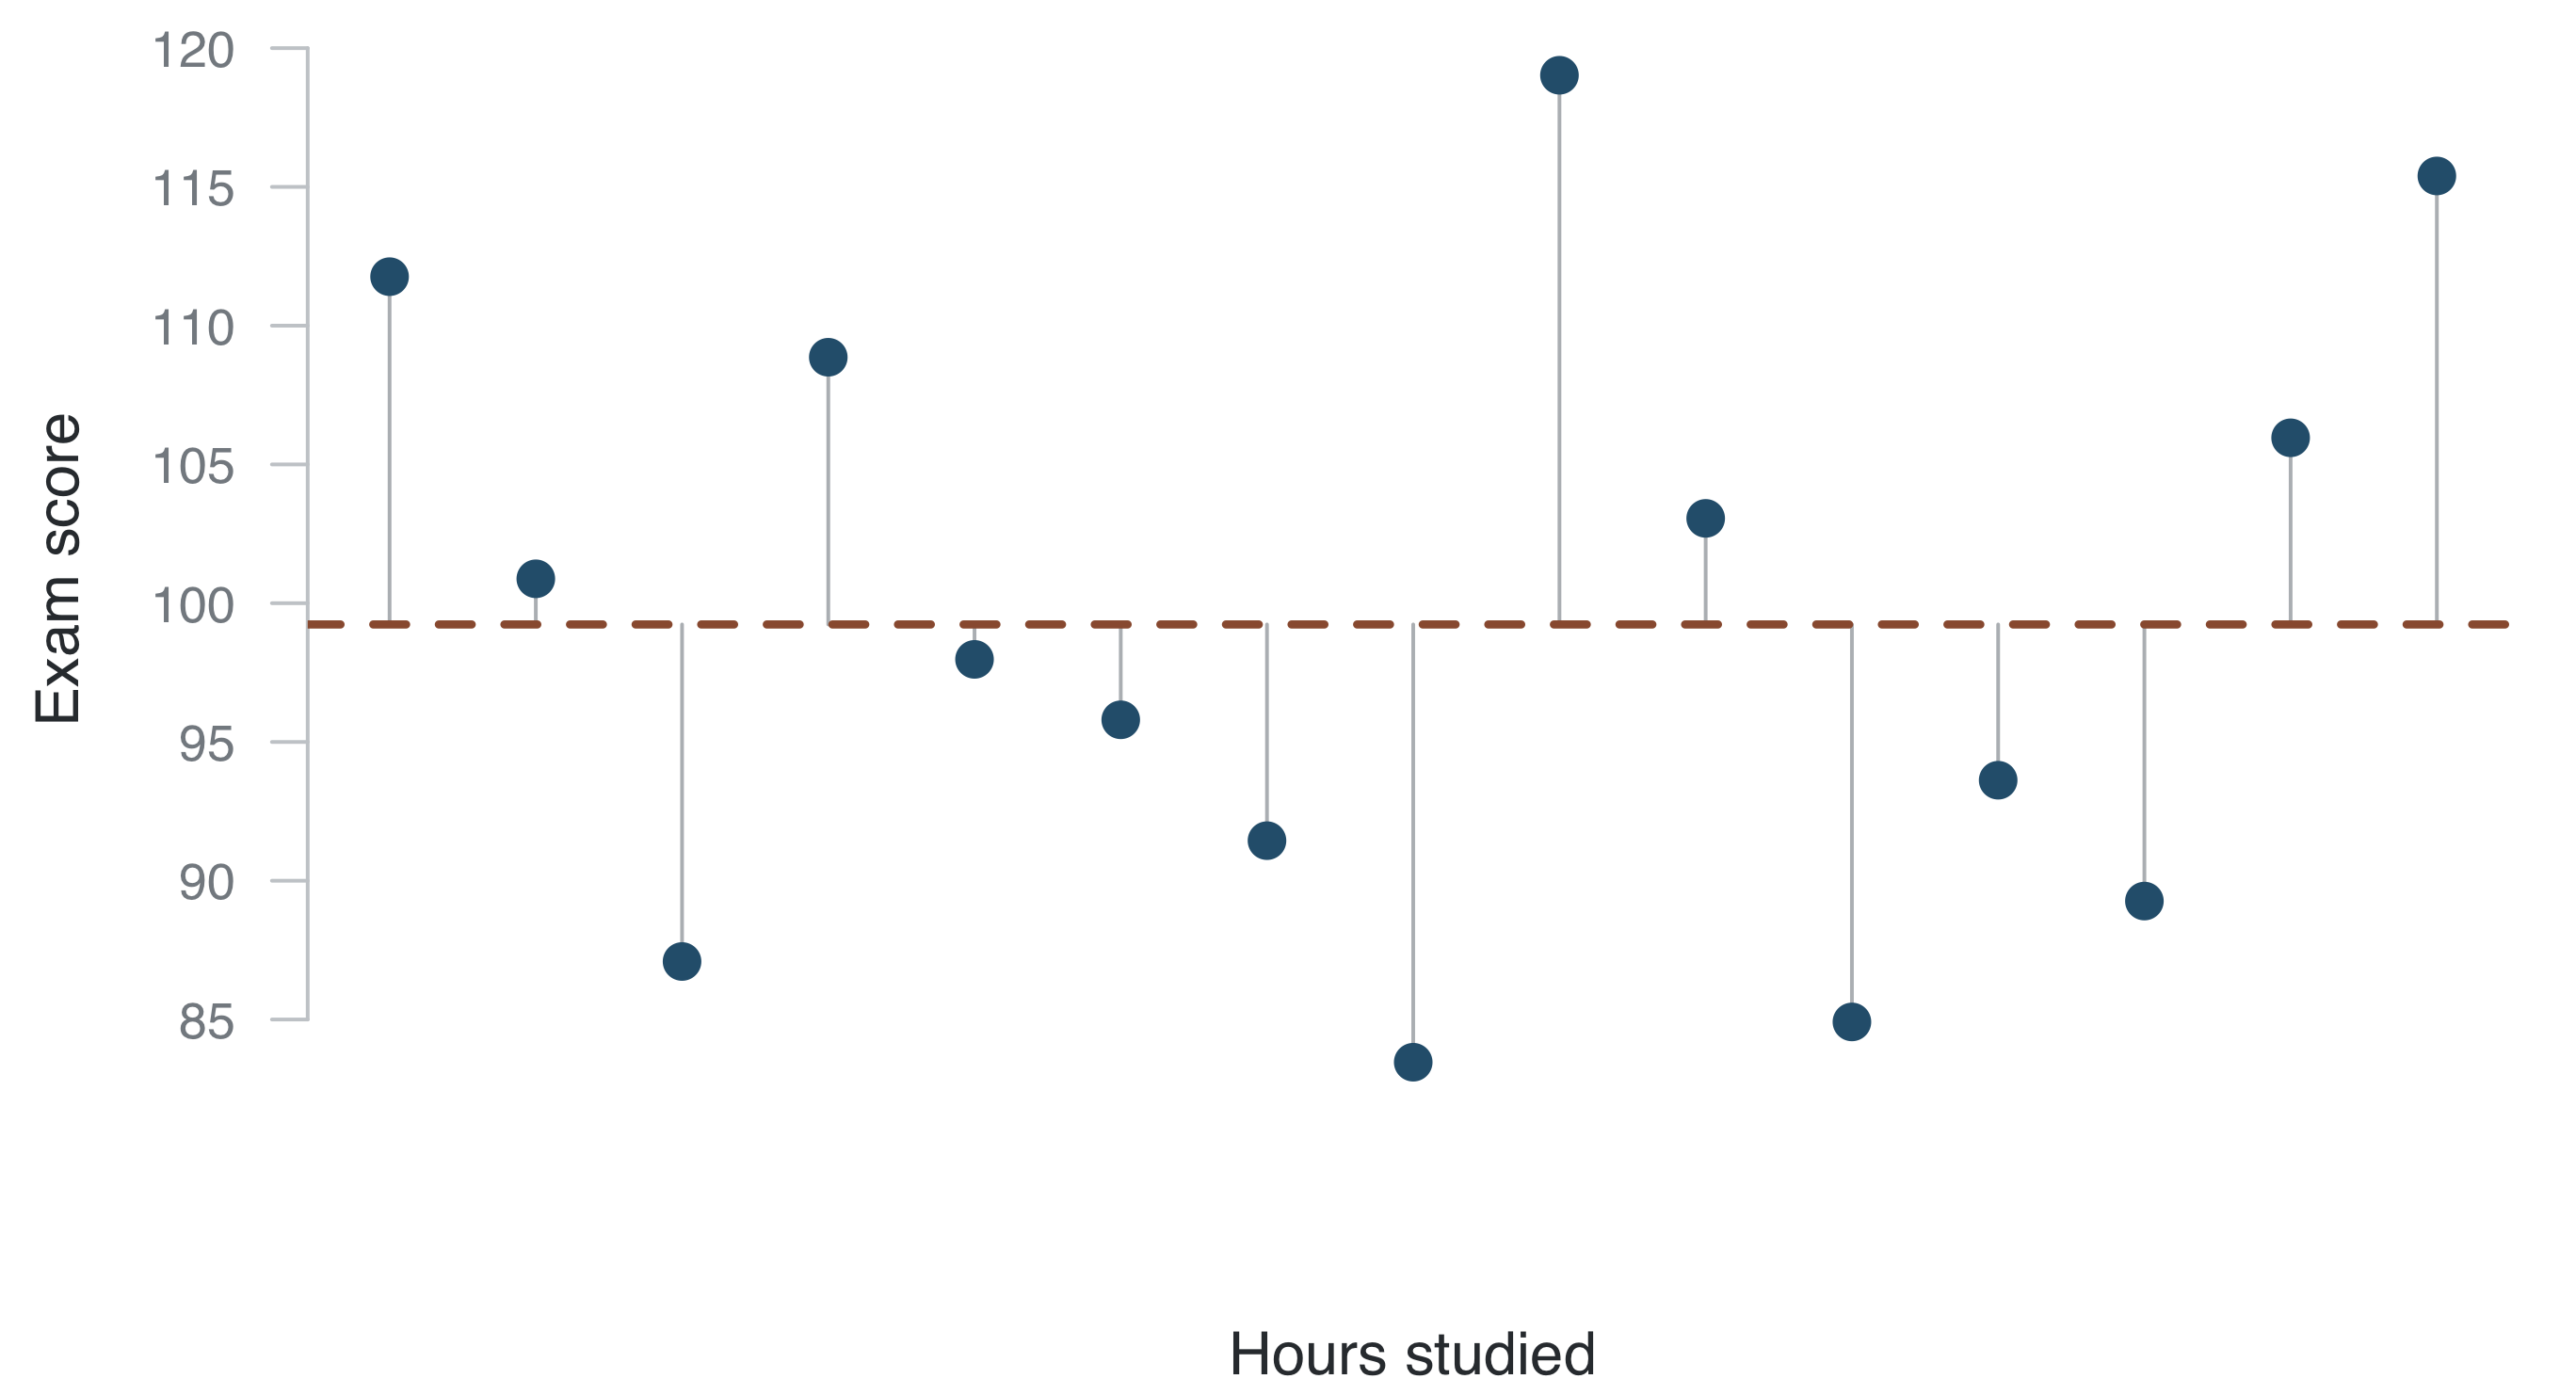
Using hours studied, can we then make a better prediction of \(y\) using \(x\)?

Predict y
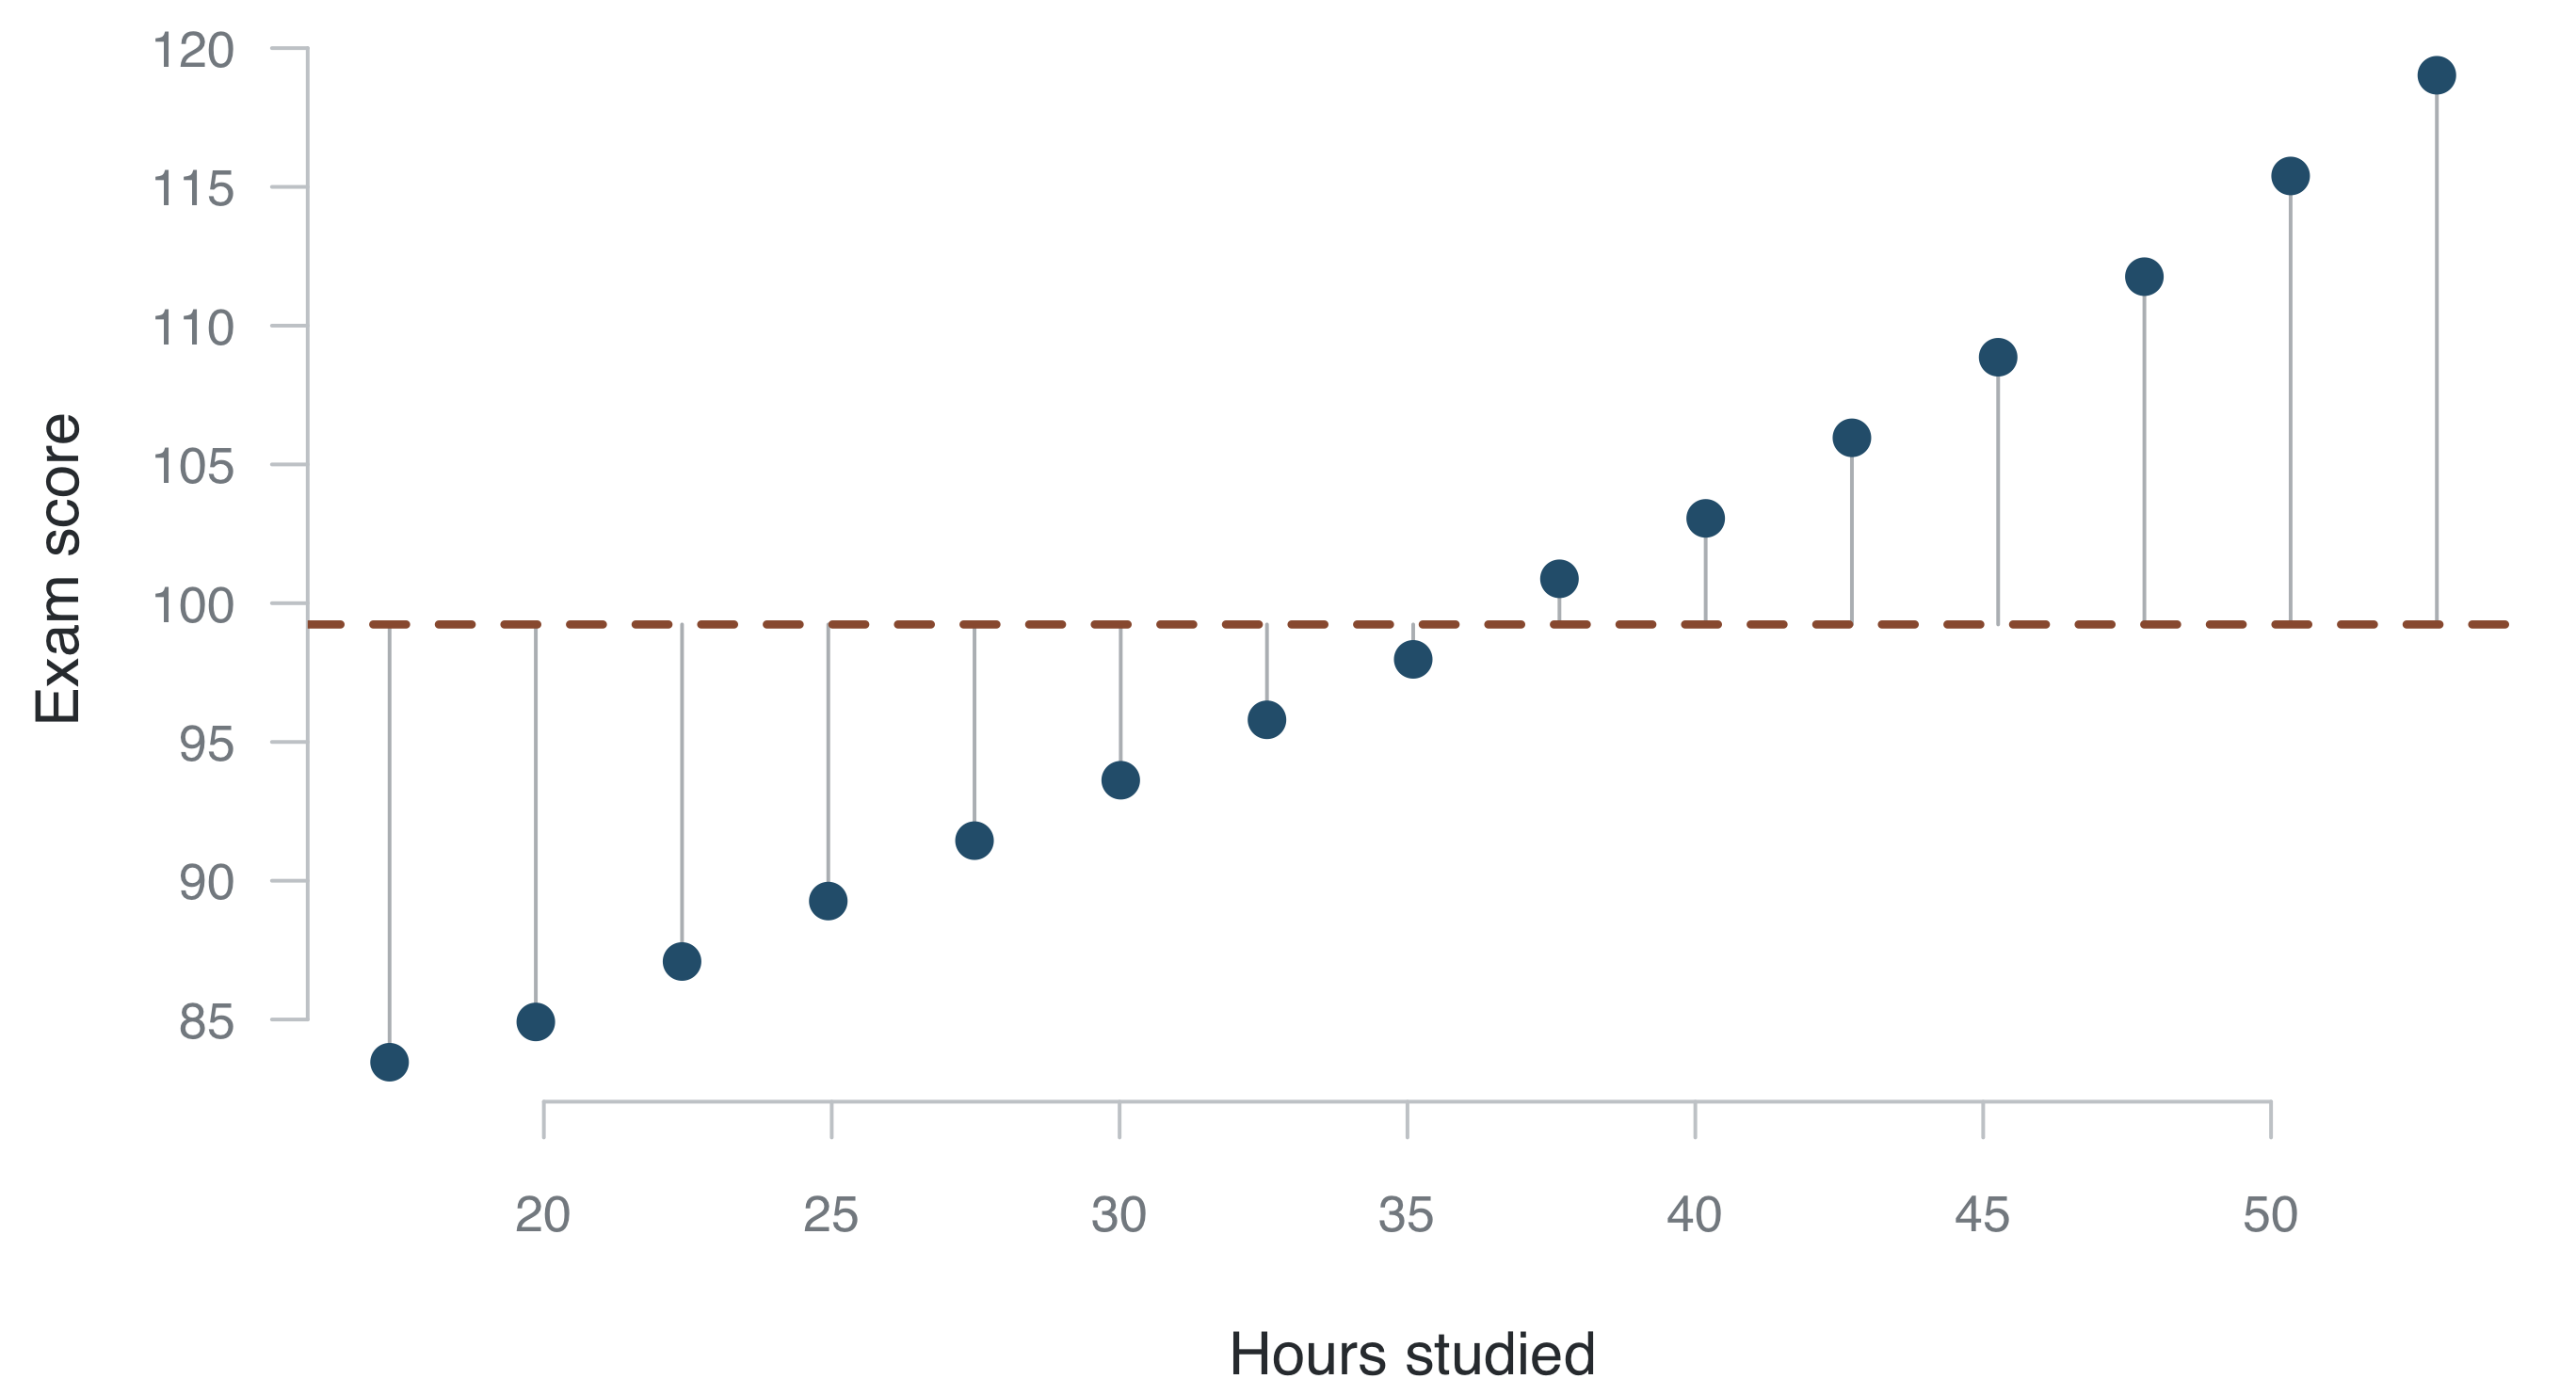
If we sort by that information. Perhaps we can improve our best guess of \(y\)?

Predict y
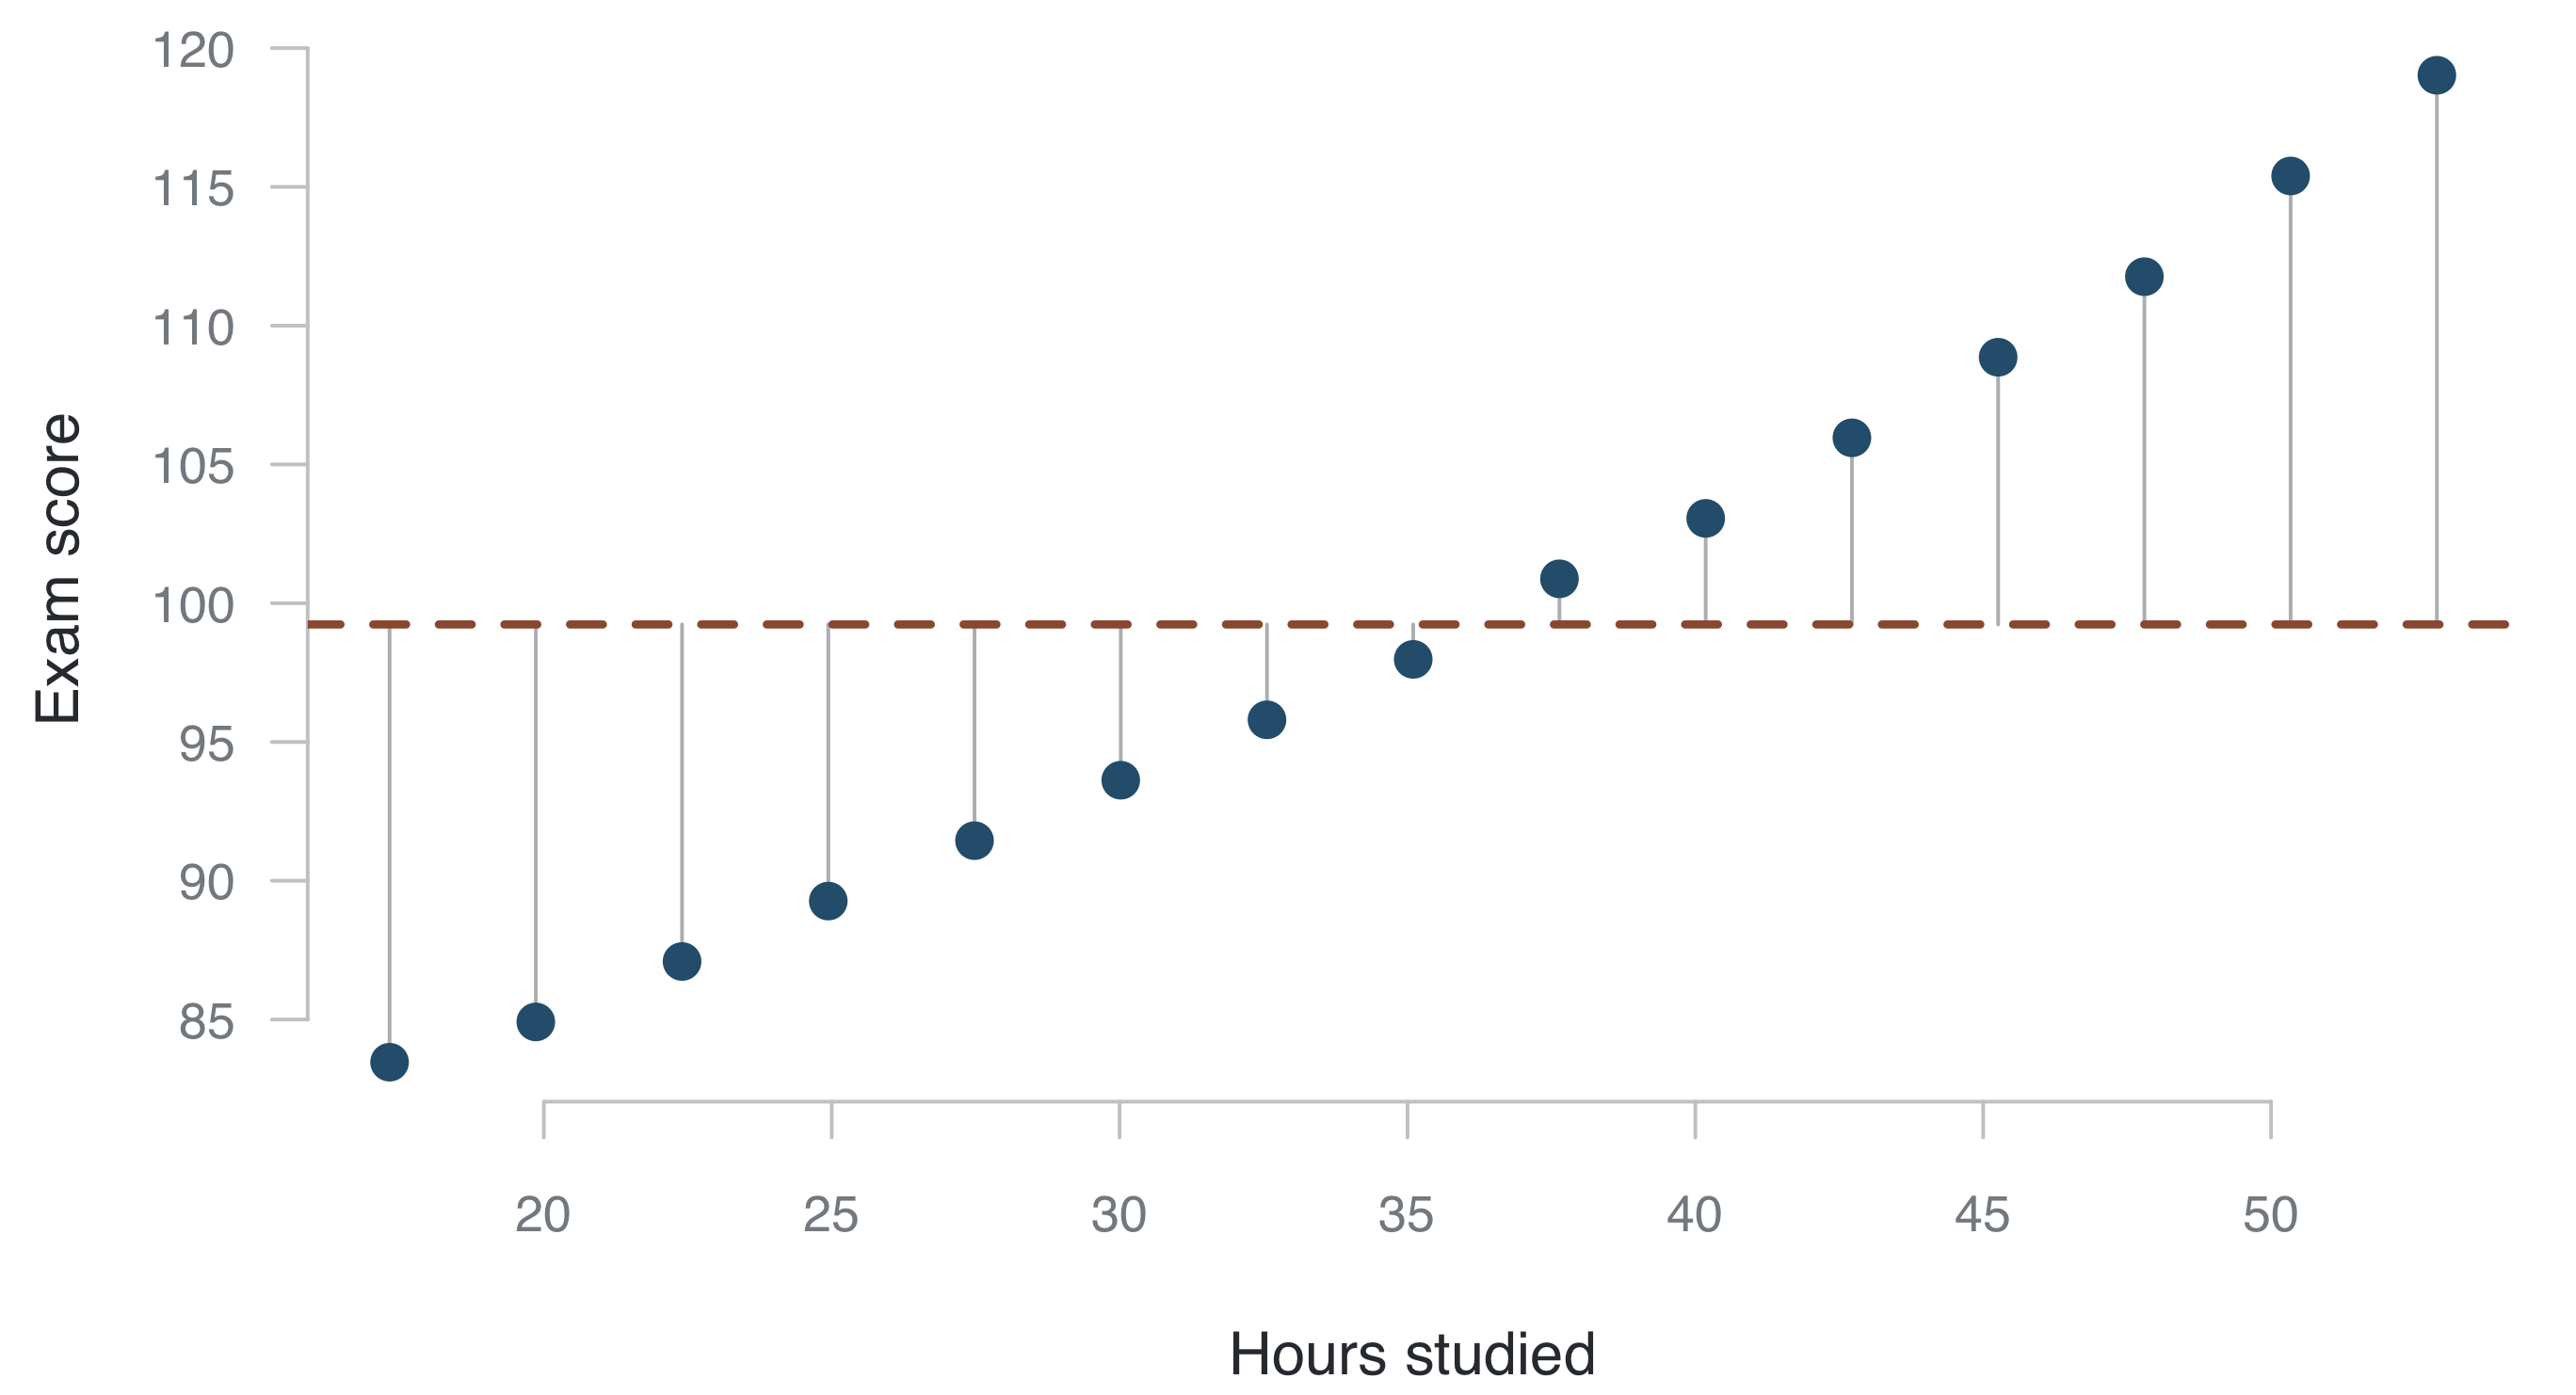
Can we draw a straight line with fewer residuals?

Predict y using x
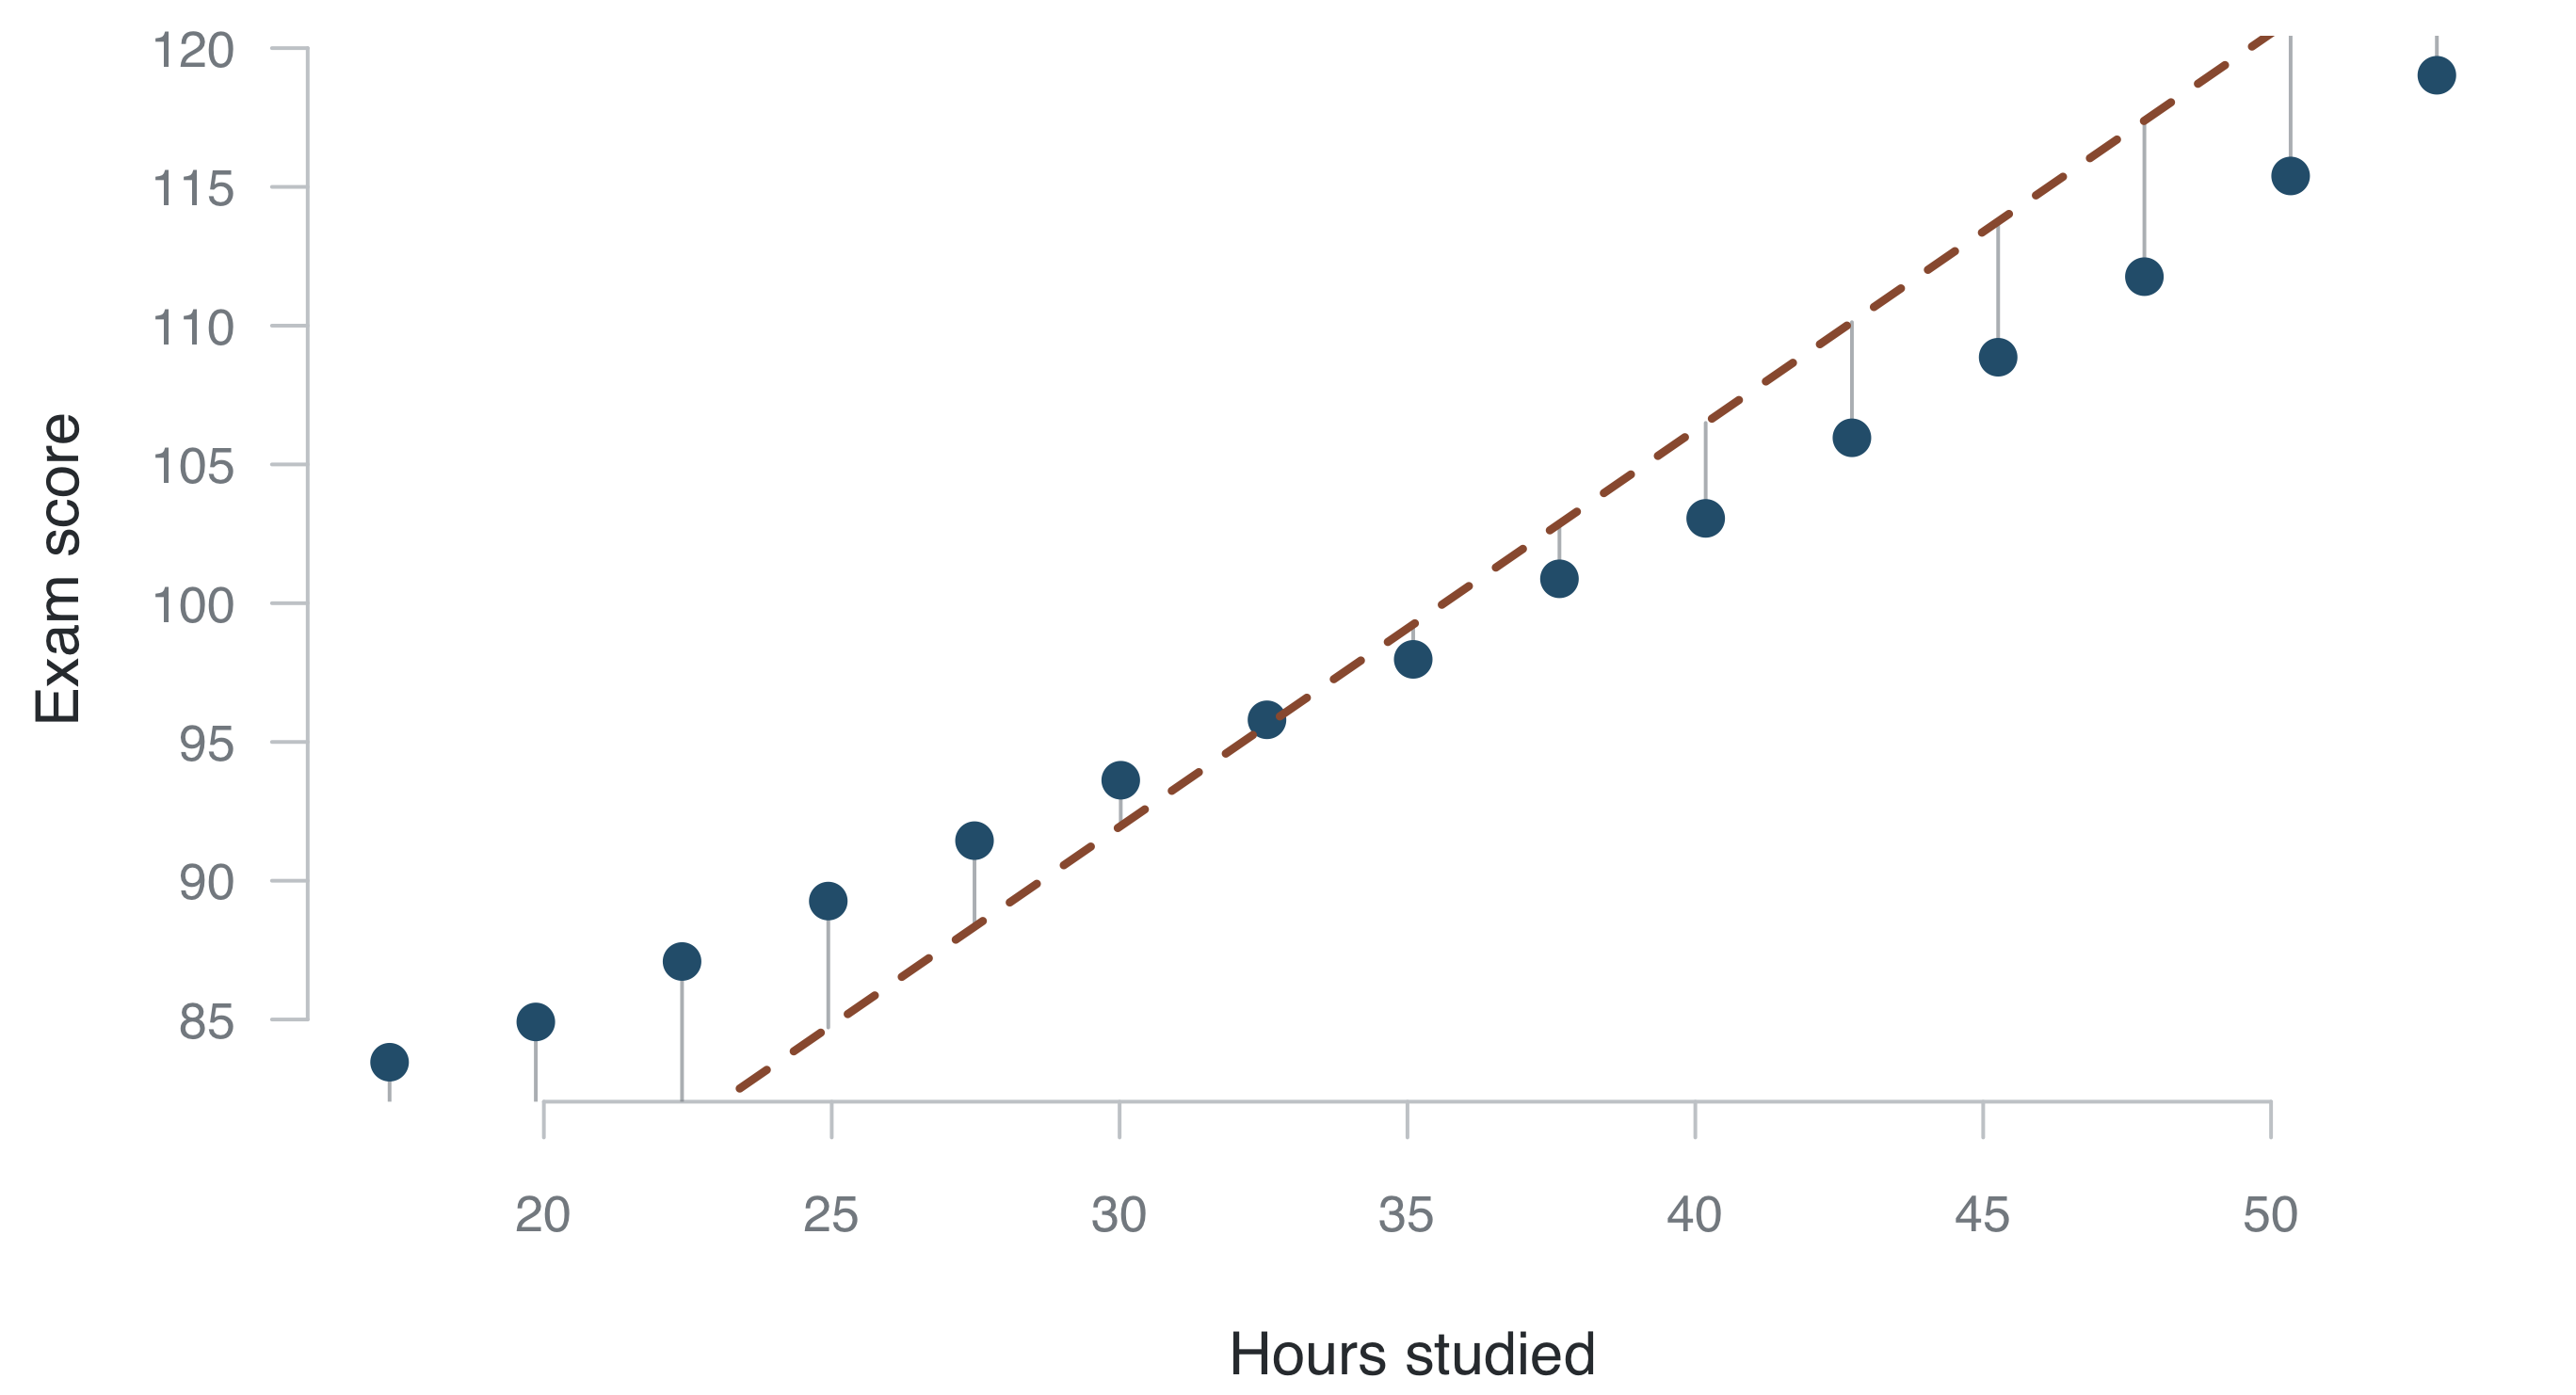
Better. But what line has the least residuals?

Predict y using x
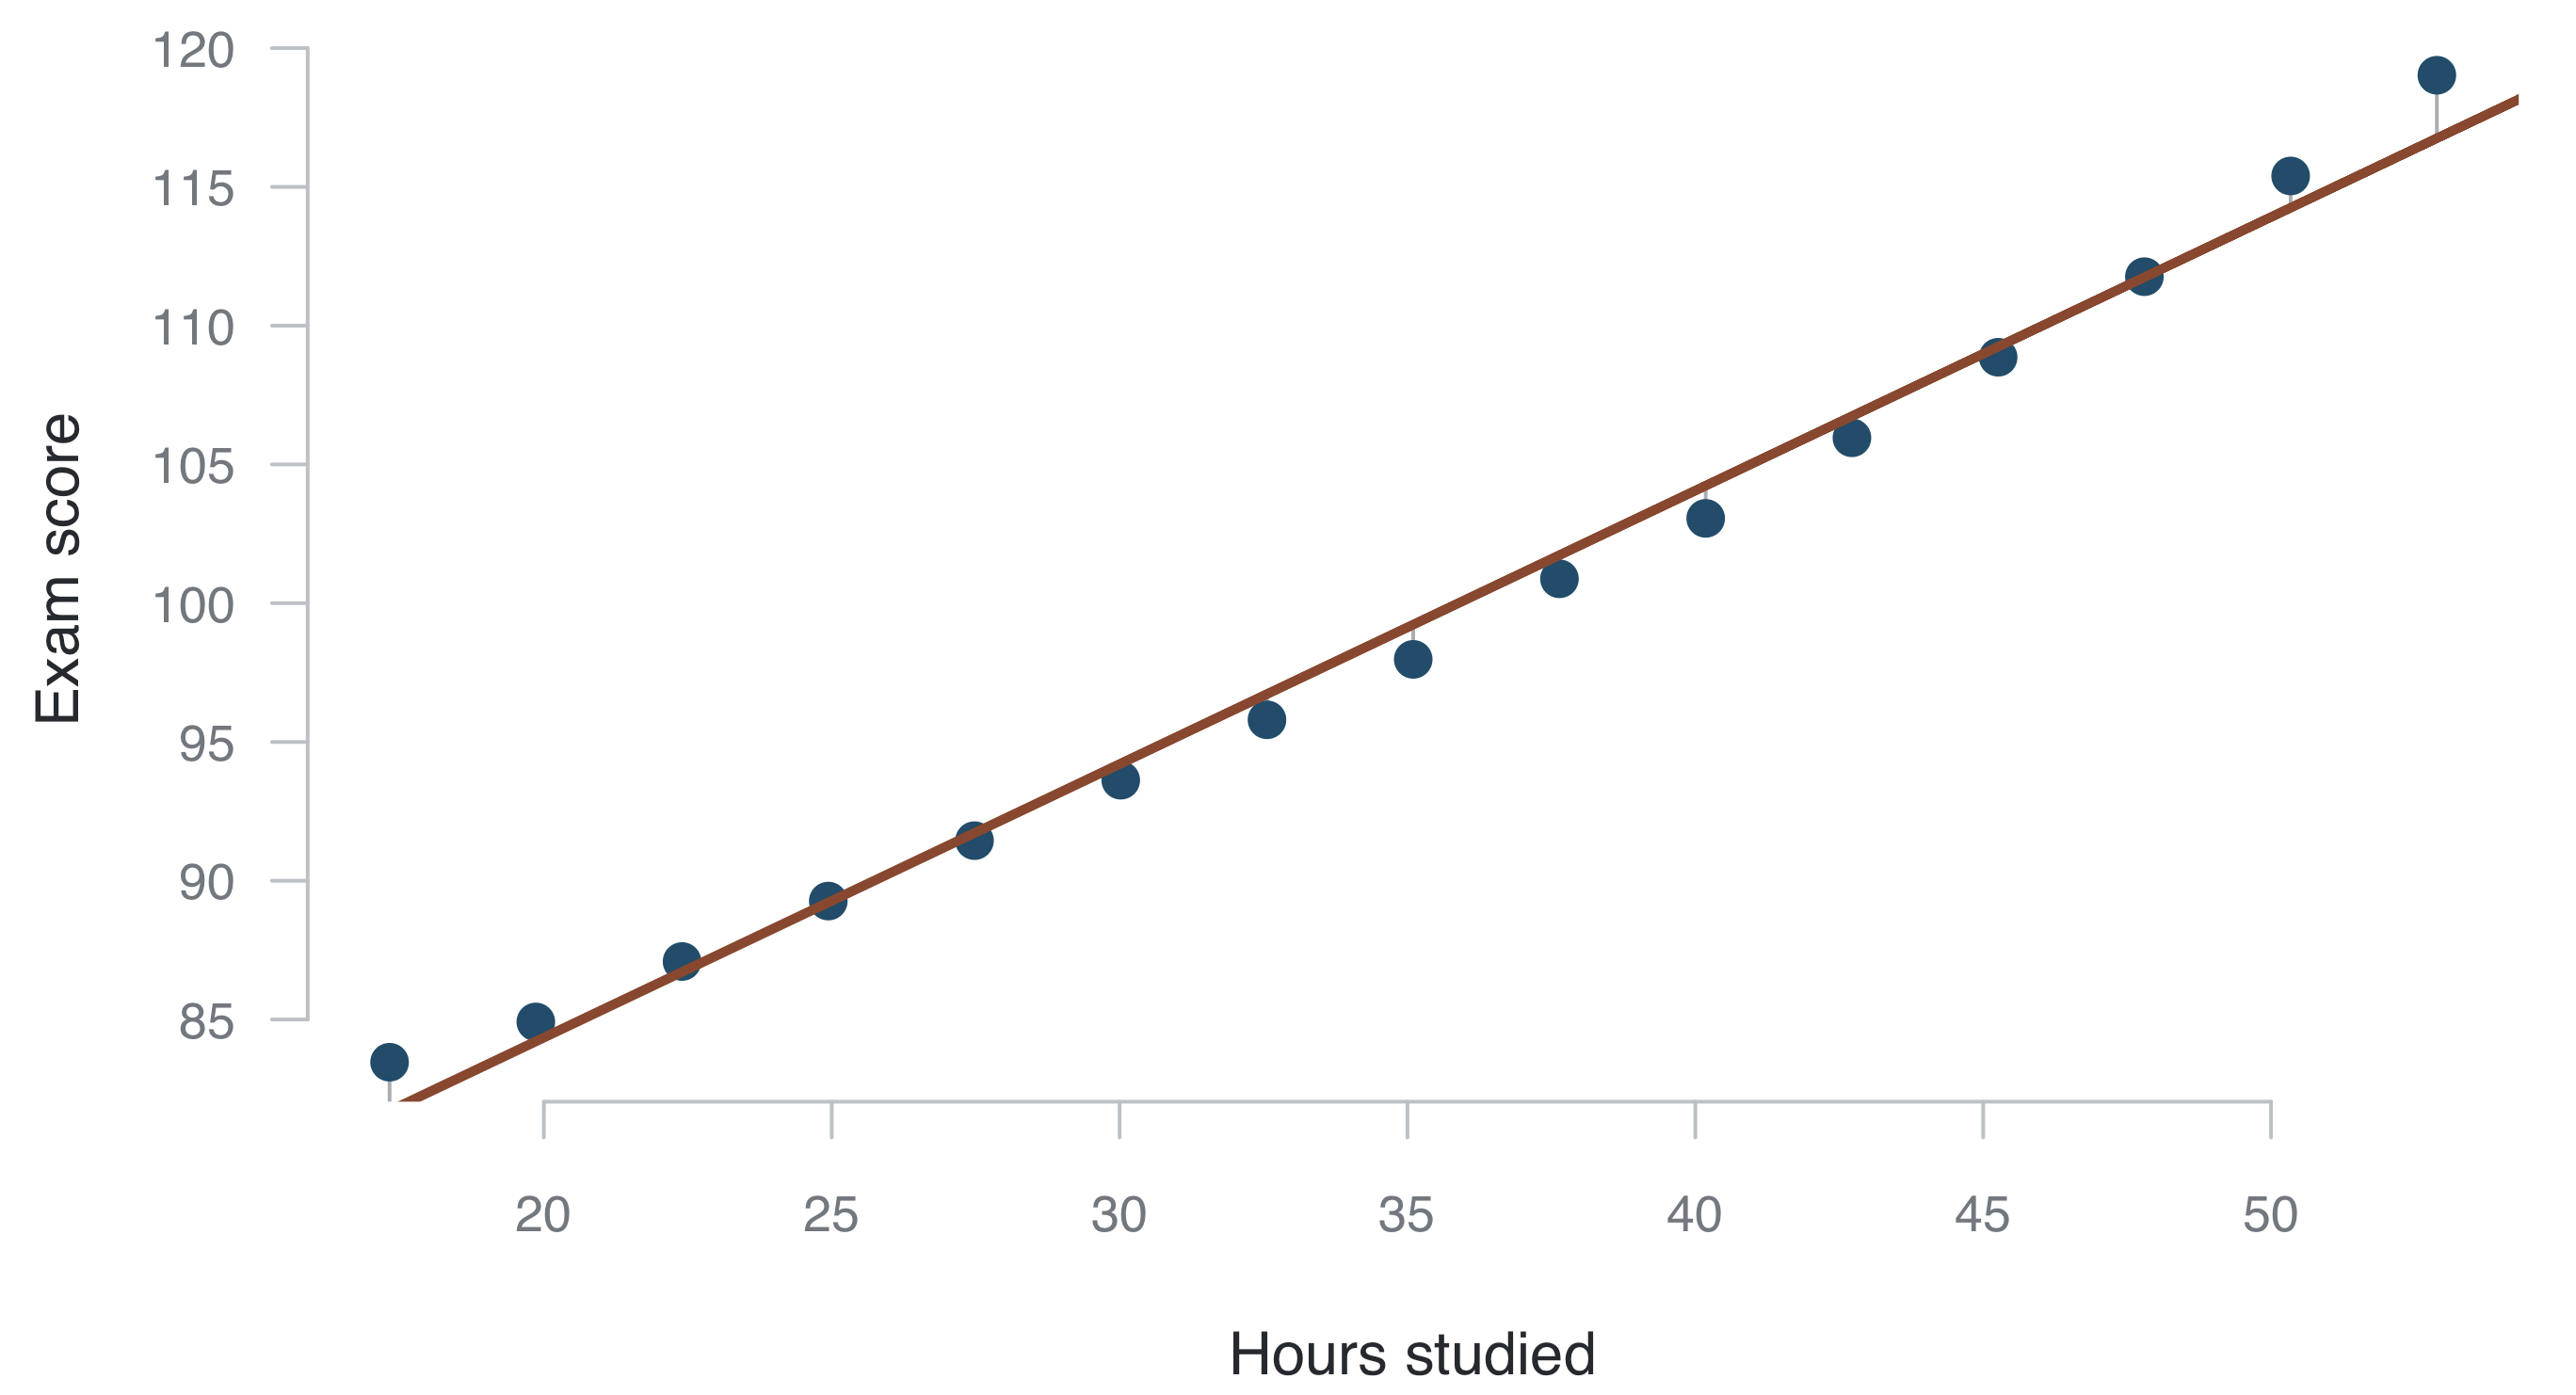
This line has the least residuals. It is a regression line 🎉.

Back to the data
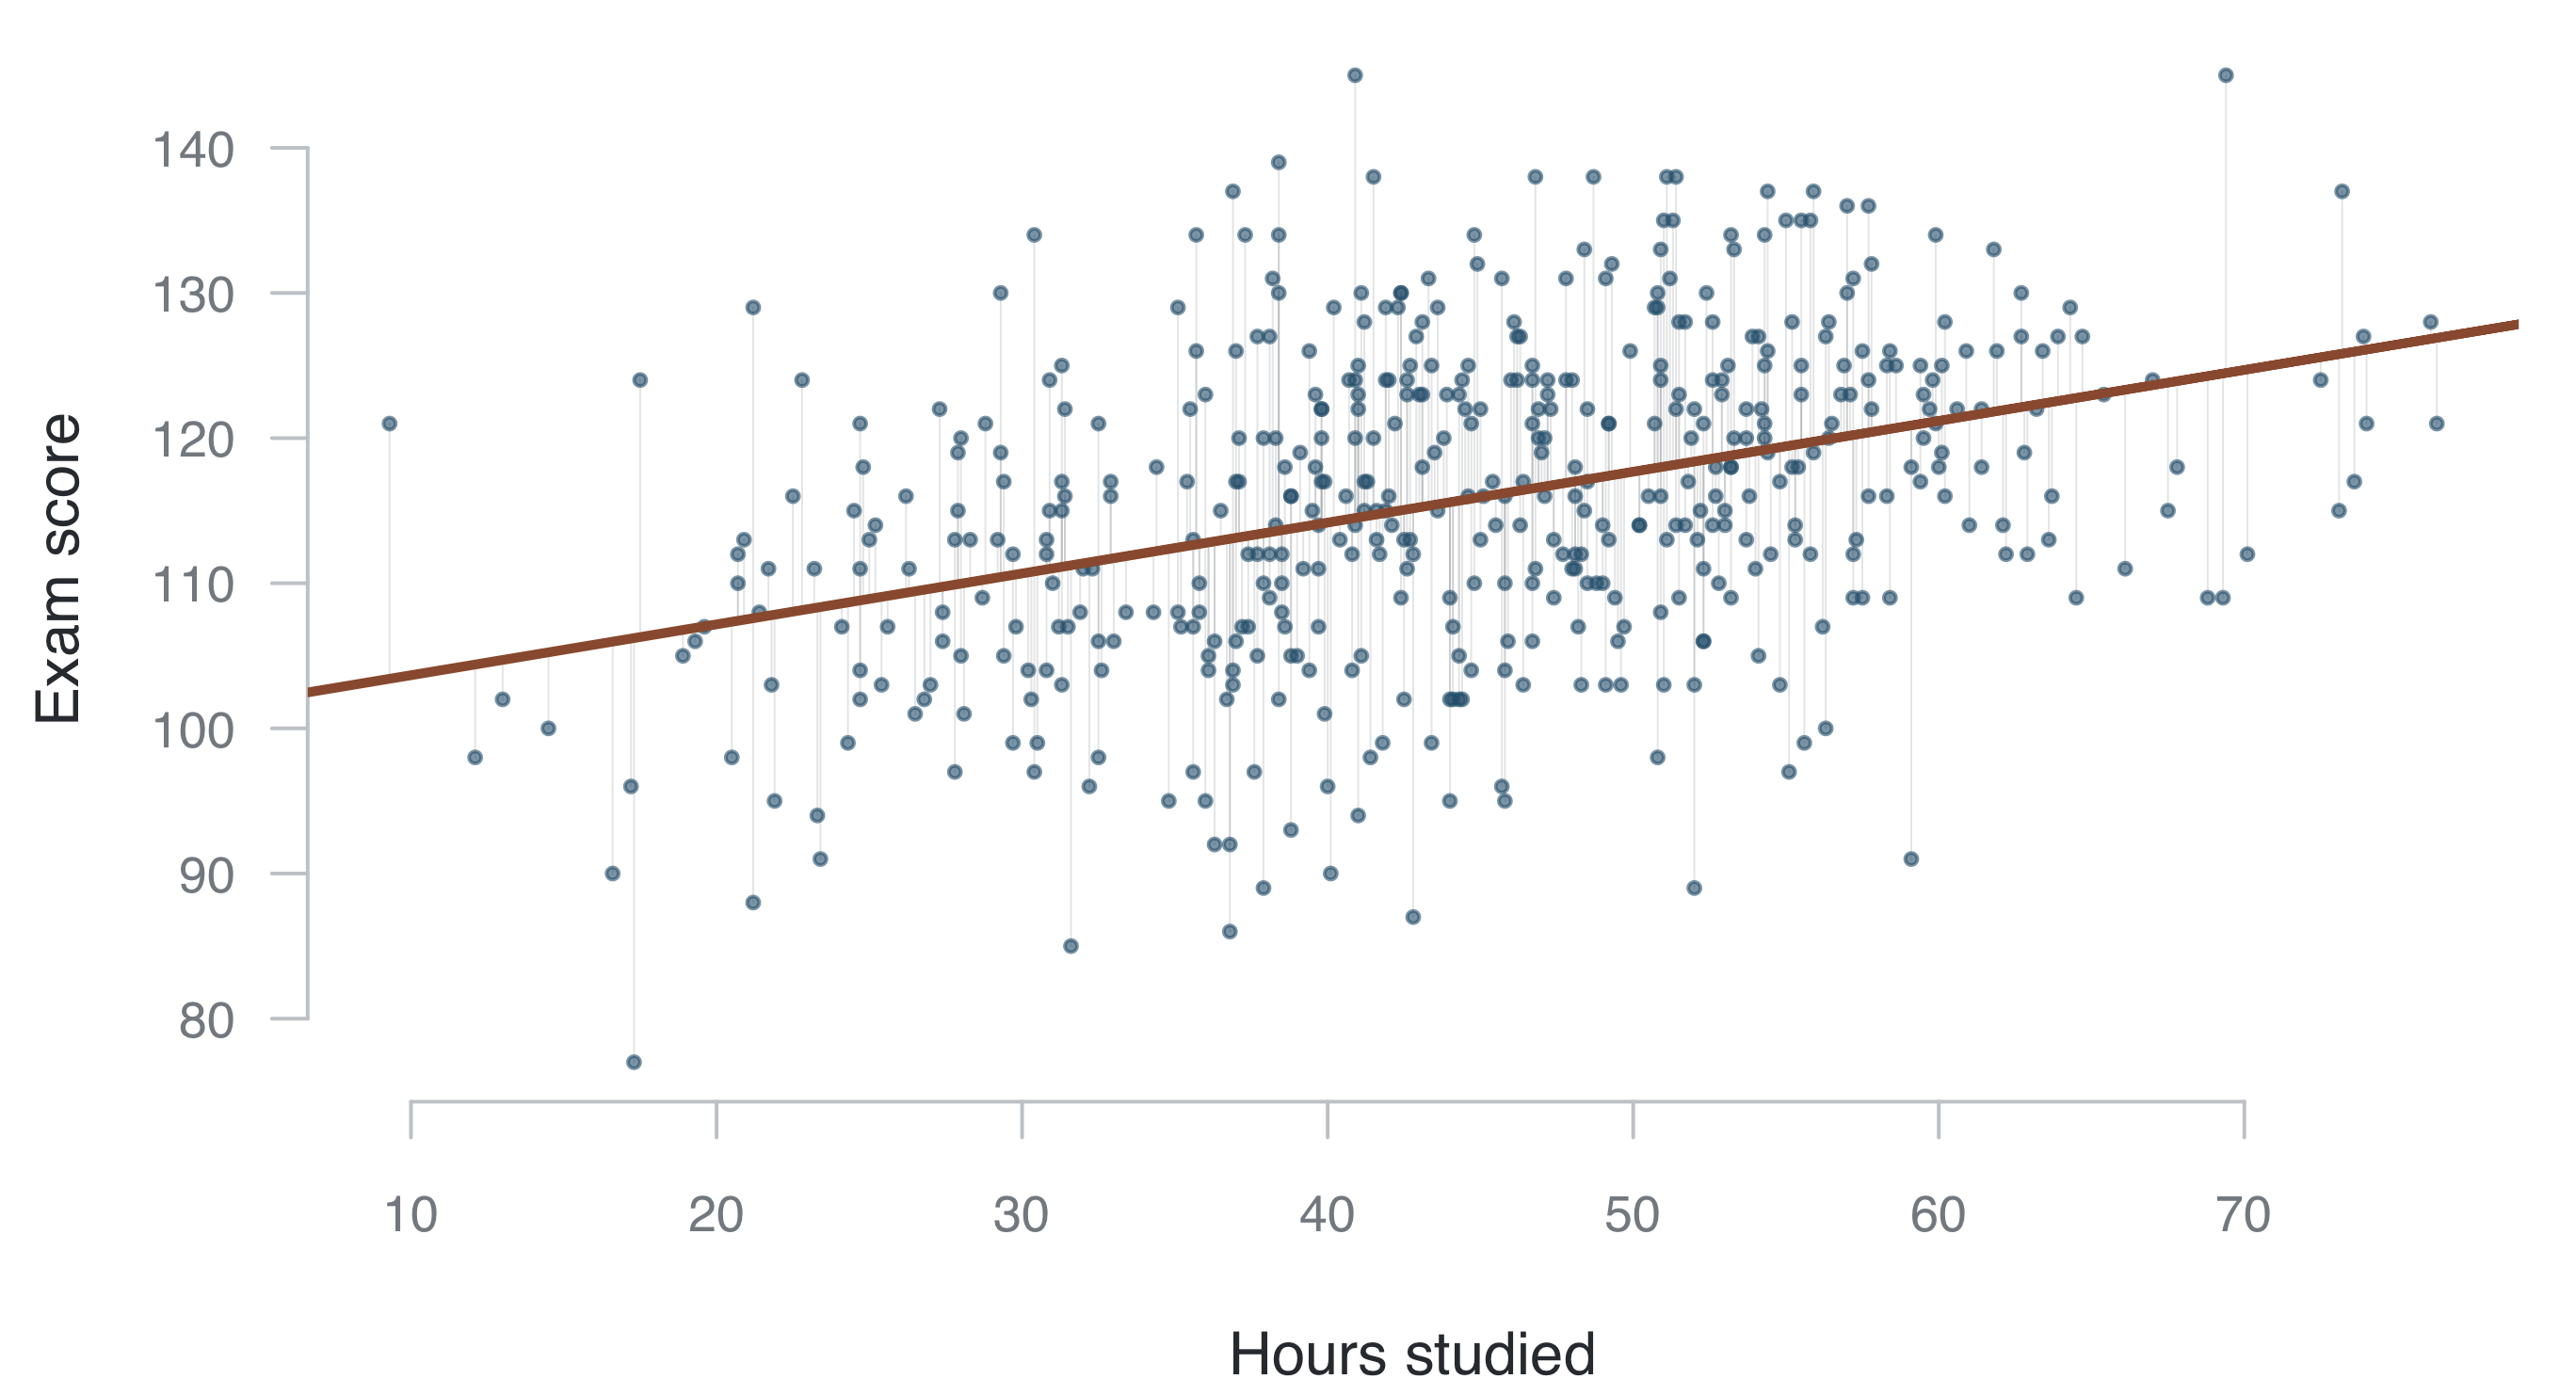
The same line, found the same way, on the data we started with.

Back to the data
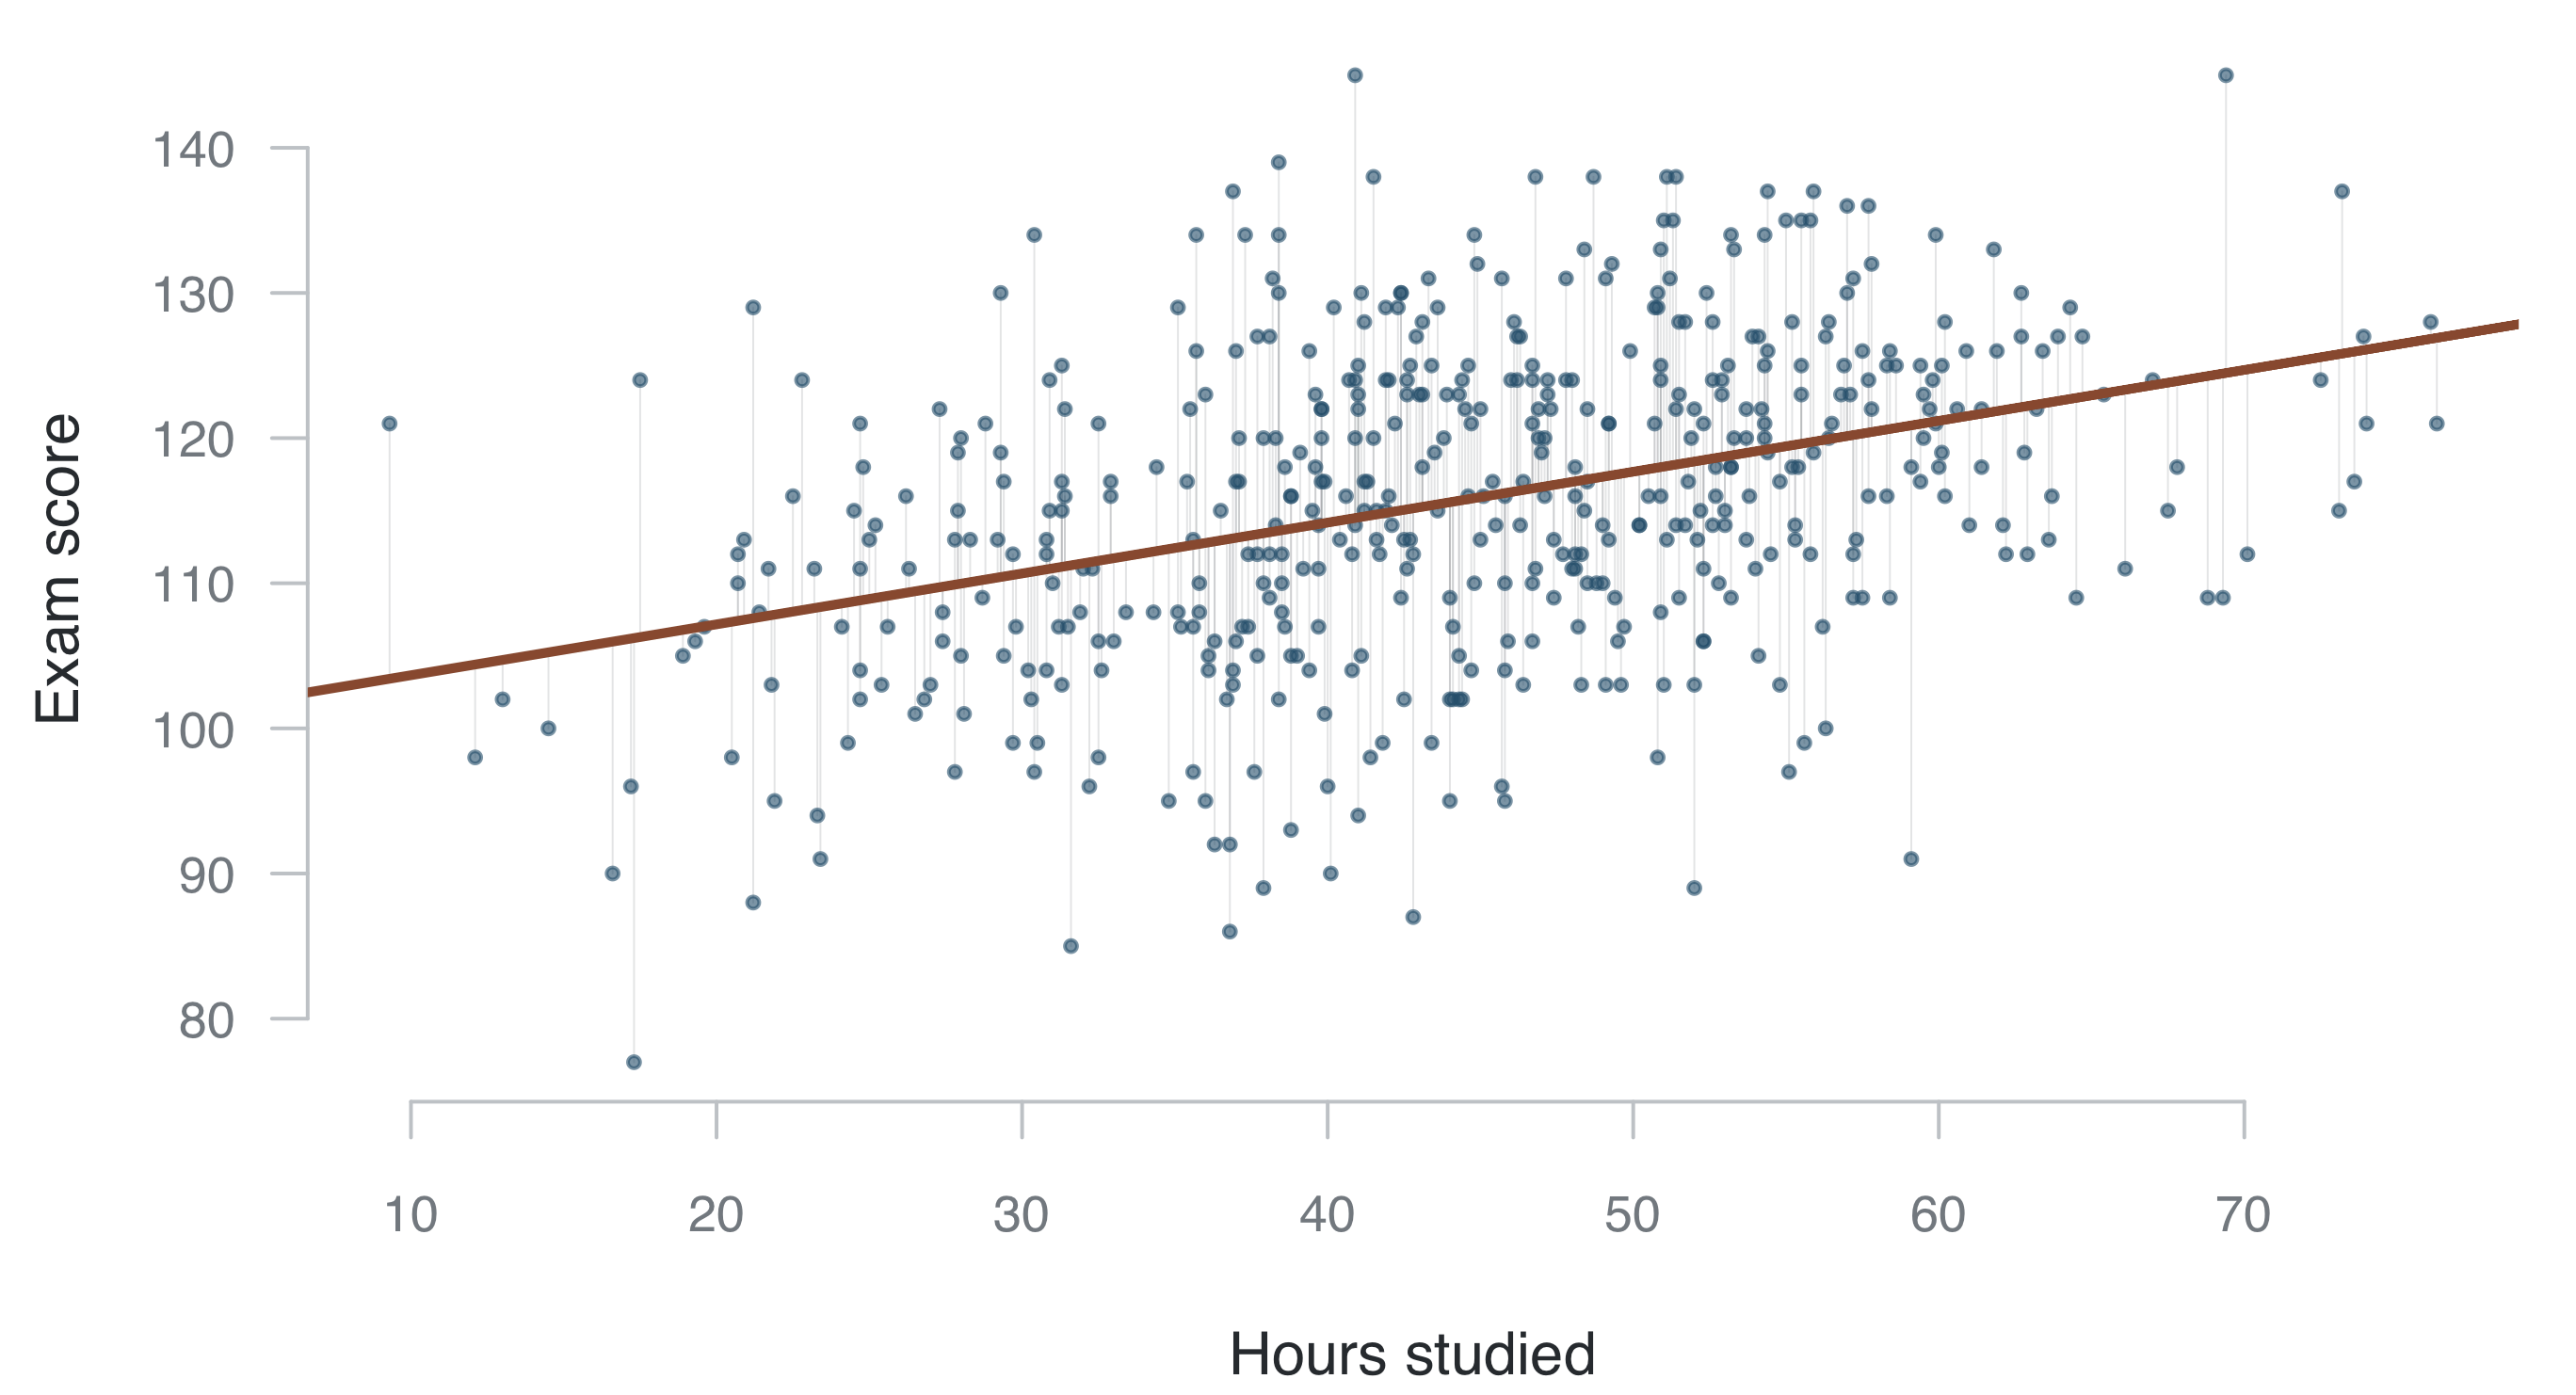
No other straight line leaves a smaller sum of squared residuals than this one.

Regression as a straight line

The straight line equation

\[ y = a + b \cdot x \]

  • \(a\) is the intercept: where the line crosses at \(x = 0\)
  • \(b\) is the slope: how much \(y\) moves when \(x\) goes up by one

A simple example

\[ y = 0 + 1 \cdot x \]

  • If \(x = 2\), then \(y = ?\)
  • If \(x = 10\), then \(y = ?\)

Another

\[ y = 21 + 2 \cdot x \]

  • If \(x = 0\), then \(y = ?\)
  • If \(x = 10\), then \(y = ?\)

Moving the line

y = + × x

Moving the line on the data

ŷ = + × hours studied

Regression as an equation

\[ \widehat{\text{exam score}} = 100.2 + 0.35 \cdot \text{hours studied} \]

  • We can now predict the exam score if we know how many hours a student studied.
  • Someone who studied 20 hours: predicted 107.2
  • One additional hour of study: 0.35 points

The regression result

This is a predictive model, fitted on our data. Give it a number of hours and it hands back a predicted exam score.

With these 500 students, and using nothing but hours studied, no straight line predicts better than this one.

How “good” this fit is for the upcoming weeks.

Regression in R

Three lines of R

exam <- read.csv("../Lab/simulated_exam_data.csv")
fit  <- lm(exam_score ~ hours_studied, data = exam)
summary(fit)

Those three lines read the file, fit the model, and print the result. The rest of the course is about reading what comes back.

What R prints


Call:
lm(formula = exam_score ~ hours_studied, data = exam)

Residuals:
     Min       1Q   Median       3Q      Max 
-29.8904  -6.6108   0.0568   6.7932  30.4947 

Coefficients:
               Estimate Std. Error t value Pr(>|t|)    
(Intercept)   100.15622    1.75224  57.159   <2e-16 ***
hours_studied   0.35083    0.03812   9.203   <2e-16 ***
---
Signif. codes:  0 '***' 0.001 '**' 0.01 '*' 0.05 '.' 0.1 ' ' 1

Residual standard error: 10.27 on 493 degrees of freedom
Multiple R-squared:  0.1466,    Adjusted R-squared:  0.1449 
F-statistic:  84.7 on 1 and 493 DF,  p-value: < 2.2e-16

It is the same equation

\[ \widehat{\text{exam score}} = 100.2 + 0.35 \cdot \text{hours studied} \]

(Intercept) is the \(a\) from before and hours_studied is the \(b\). R has handed back the straight line, and that is what we call the regression result.

Interpreting the coefficient

Write it like this

A one-hour increase in hours studied is associated with an average change of 0.35 points in exam score.

Another phrasing

Comparing two students who differ by one hour of study, the one who studied more is predicted to score 0.35 points higher, on average.

The parts of that sentence

  • a one-hour increase says how far \(x\) moves. One hour, not one unnamed unit
  • an average change says it is about the whole group. No one student is promised 0.35 points
  • is associated with says we are not claiming the studying caused it

This is the single place where most marks are lost on the exam. Learn the wording now, while the model is simple.

The general form

A one-[unit] increase in [x] is associated with an average change of [b] [units of y] in [y].

Fill in the brackets and you have interpreted any OLS coefficient.

Caution

We will add more to this general form when we have more than one predictor, but the first part stays the same.

Have we proved that studying more leads to higher exam scores?

Six common reasons you find associations using regression

# Reason Why that shows up as an association
1 X causes Y Change X and Y follows, so the two move together
2 Y causes X Change Y and X follows, so the two move together
3 Something else causes both A third thing moves both at once
4 Who is in the data? Selection into the sample leaves a pattern among those included
5 How it was measured The measurements move together even when they in reality do not
6 Chance, or too small to matter In any finite sample, two unrelated things still show something

What to take to the exam

Be able to say what these are

  • Variation, and why “why does it vary” is the question
  • A residual
  • Sum of squared residuals
  • Outcome and predictor, dependent and independent
  • \(y\) against \(\widehat y\)
  • The intercept and the slope

Be able to do these

  • Read and write \(\widehat y = a + b x\)
  • Say why a regression is a predictive model
  • Say that the fitted line is the one leaving the smallest residuals
  • Write the interpretation sentence in full
  • Name six reasons two things correlate

In the lab

Meet a dataset, describe it, fit one model, and write it up properly.