★ EPC 2026 poster
01 / 04
The study behind the poster. Swipe right for the question, the data, the method, and what we found.
The study behind the poster. Swipe right for the question, the data, the method, and what we found.
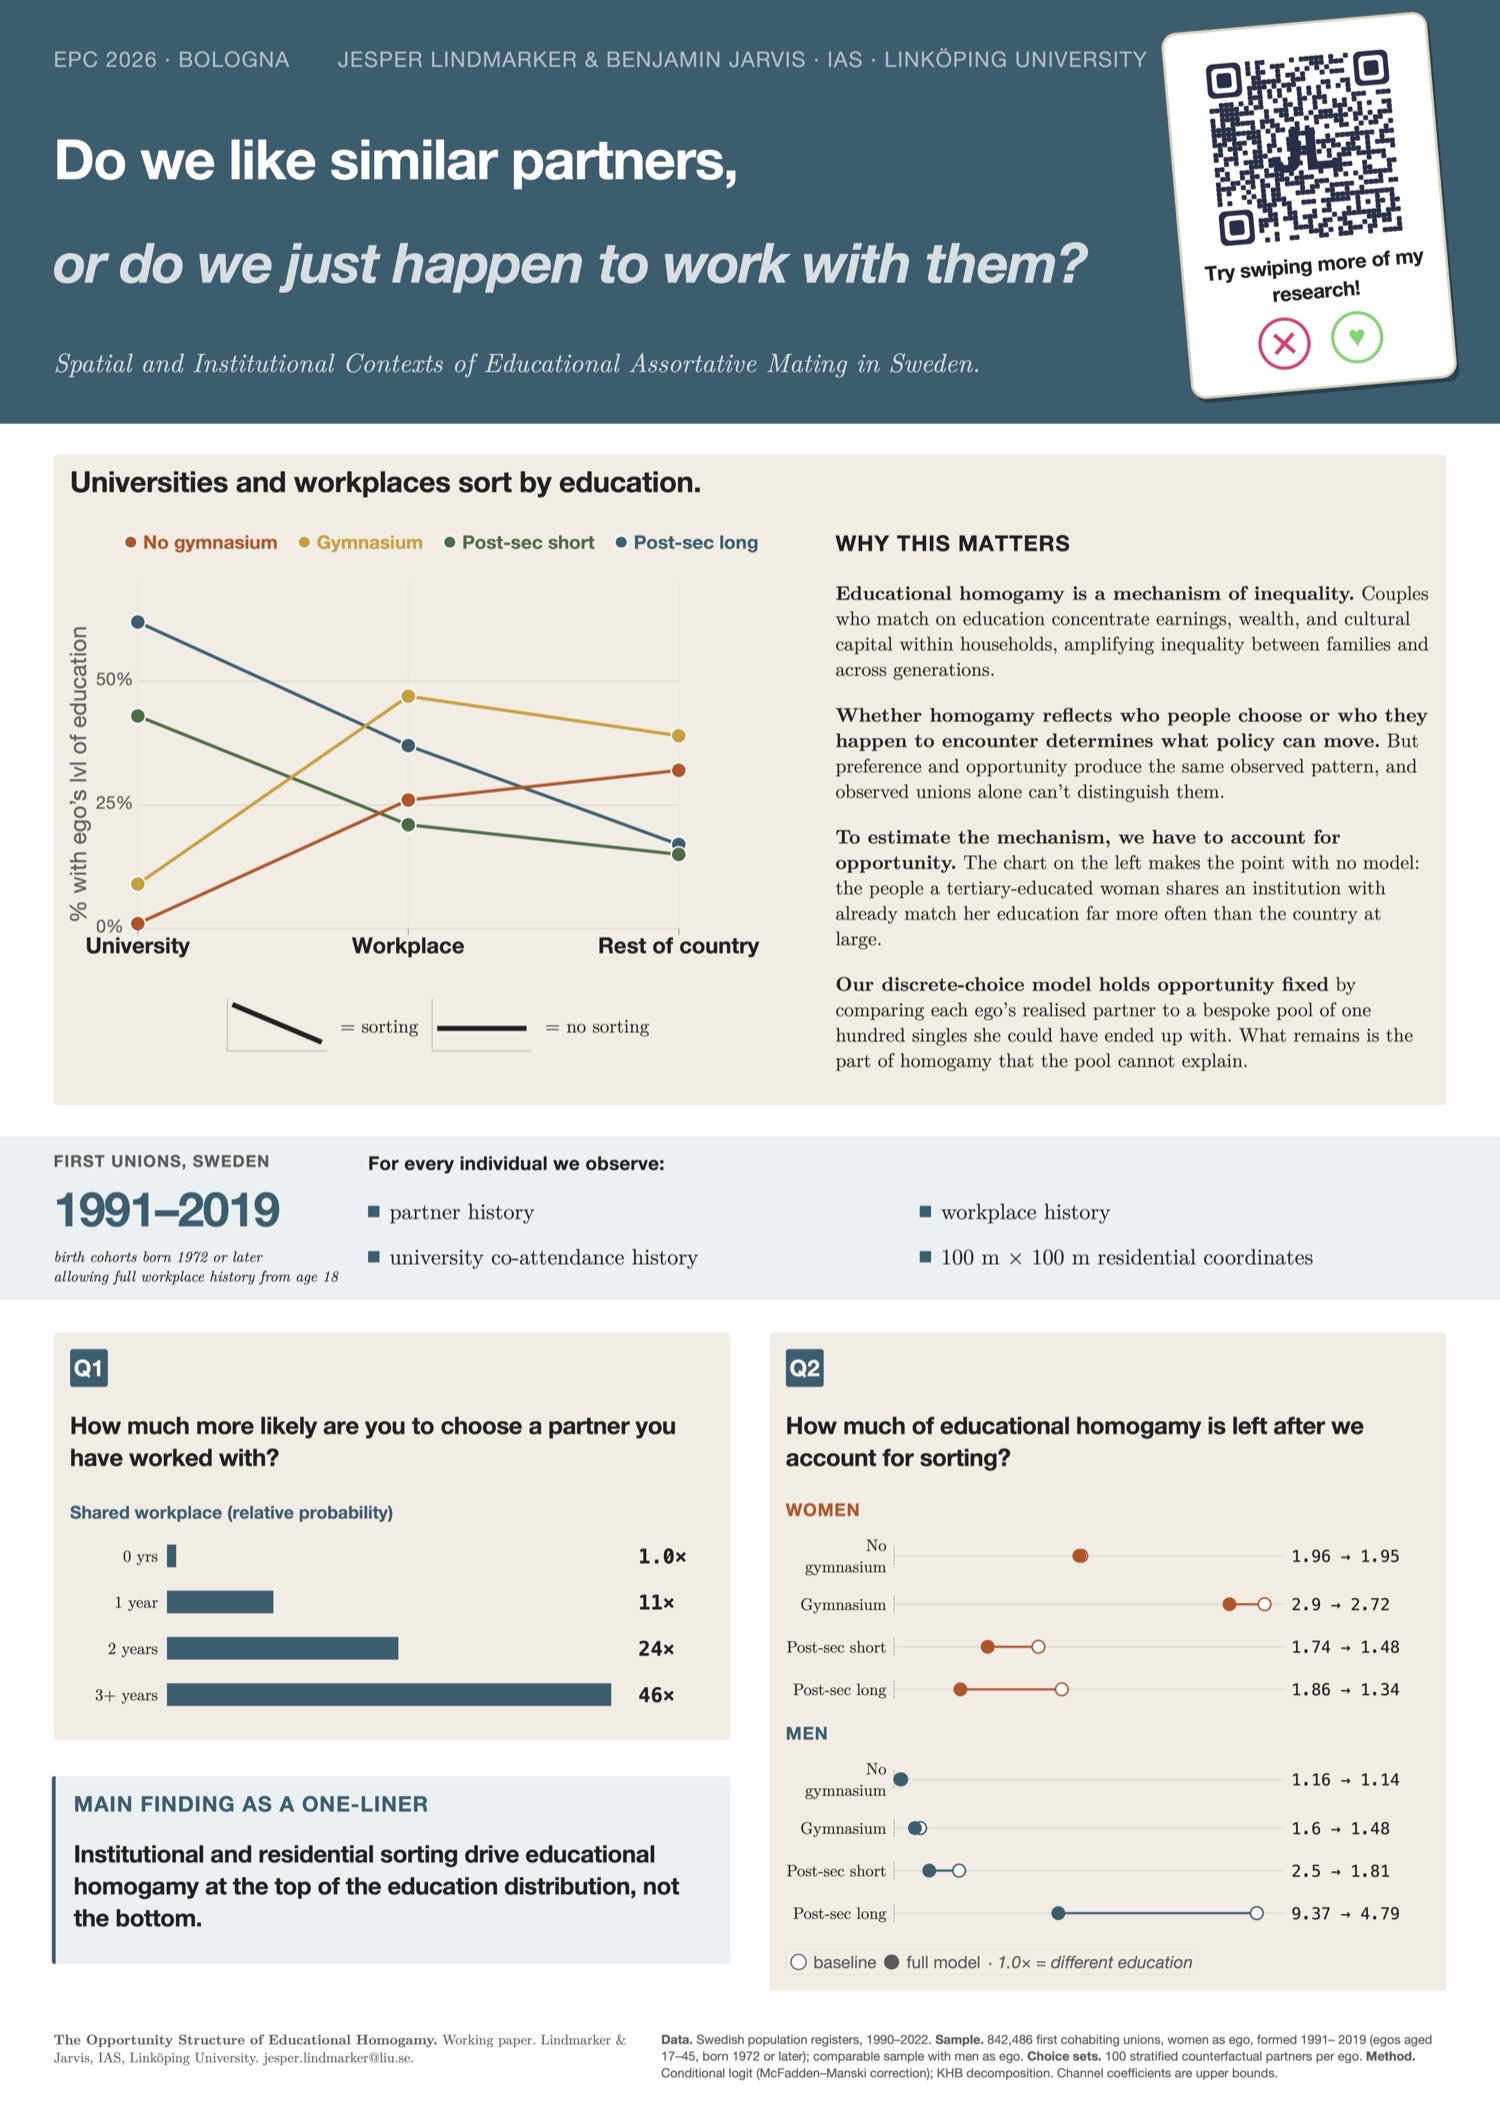
If interethnic unions keep rising, are ethnic boundaries actually softening? Or has the partner market simply shifted?
Pull the sliders. Watch couples form. See how segregation, attraction, and distance sensitivity produce the sorting we see in real Swedish data.
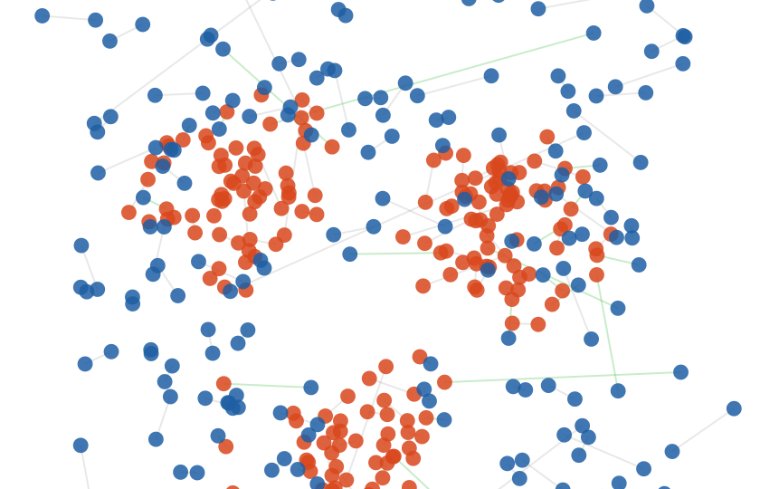
Residential proximity mediates 20 to 40 percent of ethnic endogamy. Segregation narrows the partner market before anything else gets a say.
Shared university · relative probability of a union
Shared workplace · relative probability of a union
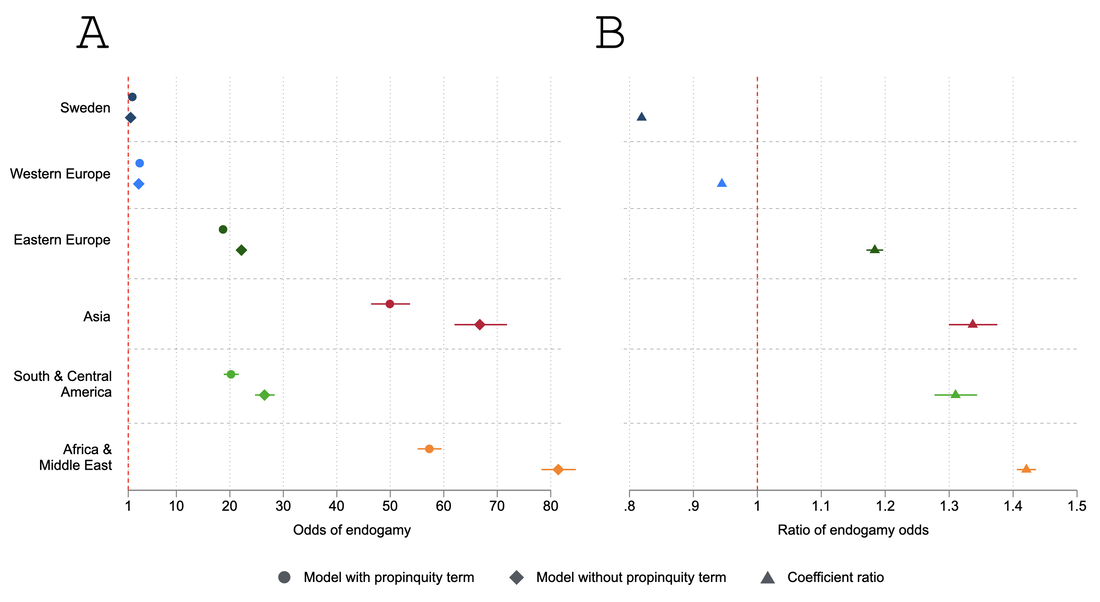
See the full Model 4 coefficient plot: every covariate, both sexes →
Each dot already holds the partner market fixed: it compares a real partner against a pool of singles the ego could plausibly have met, so the supply of similarly-educated partners, plus age, cohort, and region, is already accounted for. The hollow dot is that baseline. Drag the slider to add the settings two people actually shared, and watch the filled dot slide left toward 1×, the rate you would see if those settings explained all of it.
Swedish registers, 842,486 first unions with women as ego (men estimated separately), 1991 to 2019. Each dot pair shows the odds of partnering within rather than across education, net of the sampled choice set and controls for age, cohort, and region; 1× means education carried no weight. The slider adds only shared institutions and residential distance, in the order people meet them. What remains is residual assortativity, an upper bound on what choice could explain, not proof of preference. KHB decomposition on the Model 4 scale.

Unfold the study →
Simulation code: github.com/jeppelina/clogit-validation-simulations.
This is the methodological cousin of the ethnic-boundaries work below: the same insistence that opportunity be modelled before behaviour gets named, applied to a different line of division. It extends an earlier study with Ben Jarvis, "However Far Away?", which showed residential proximity alone mediates 20 to 40 percent of ethnic endogamy in Sweden.
The dissertation behind this poster asks one question in four ways: how much of observed partner sorting is opportunity, and how much is residual assortativity, across ethnic and educational lines, in registers covering the full Swedish population, using counterfactual partner comparisons.
Residential proximity mediates 20 to 40 percent of ethnic endogamy. Segregation narrows the partner market before any choice is expressed.
All 2,500 pairings across 50 ancestry groups in Sweden. Seven boundary clusters emerge. The same boundary can be open for women and closed for men.
Conditional logit with Oaxaca-Blinder decomposition, 1991 to 2022. Interethnic unions rise. Residual assortativity does not weaken, and in some places strengthens.
Residence, workplaces, and universities together account for 29 to 40 percent of educational homogamy among the most educated, almost none among the least.
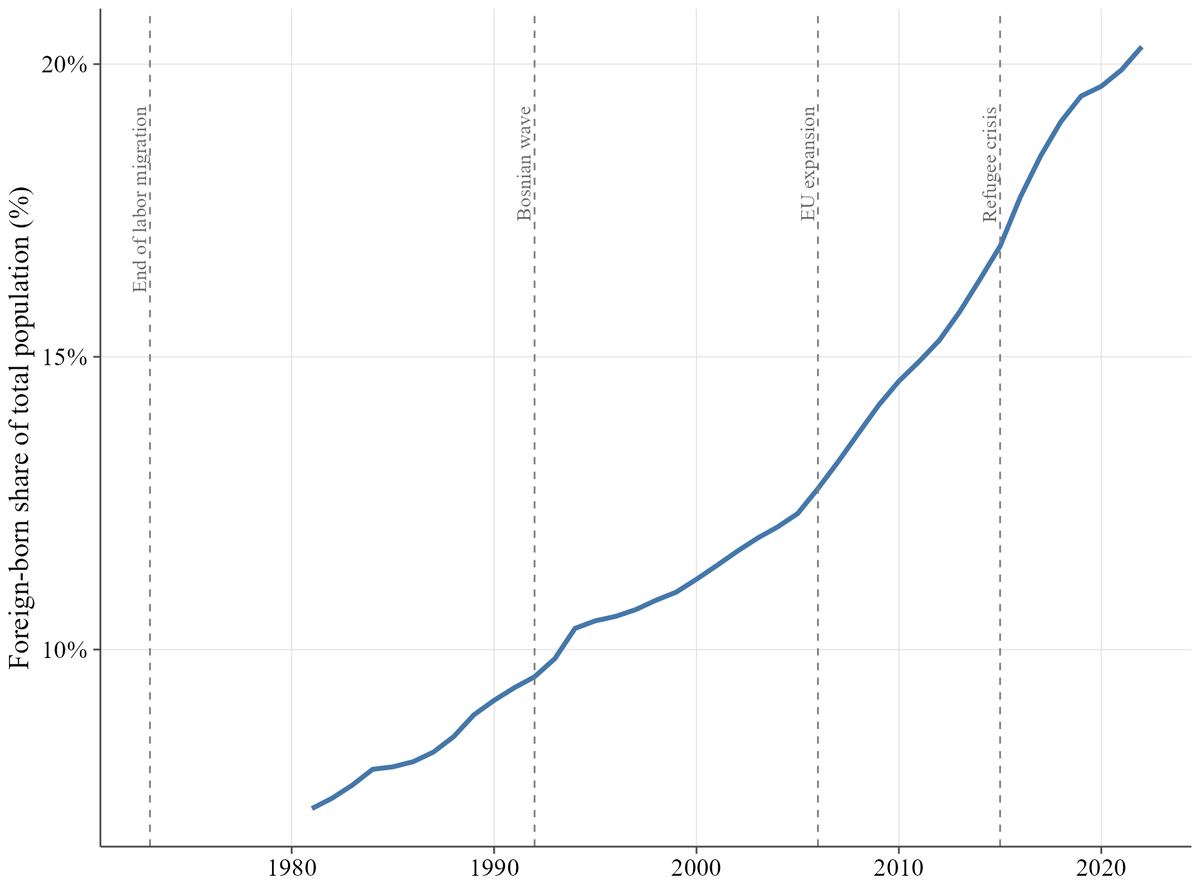
Sweden's immigrant population has grown dramatically since 1991. Ethnic diversity has reshaped the partner market. Over the same period, interethnic unions have become more common in absolute terms. That reads like integration: boundaries eroding, communities mixing, demographic progress.

When you decompose the trend, the picture inverts.
Conditional logit models that hold partner availability constant show that the residual assortativity for same-group partners has not weakened. In several configurations, particularly among Swedish-origin women, it has strengthened. The rise in interethnic unions is not a sign of softening boundaries. It is a mechanical consequence of a partner market reshaped by migration and segregation. More diversity makes same-group pairing structurally harder, even when the appetite for it is unchanged or stronger.

"Without accounting for who is actually available, we mistake a structural shift for an attitudinal one. The Swedish case shows you cannot read boundary change off mixing rates alone."
This matters for how demographic trends get interpreted. Rising intermarriage is routinely read as evidence that integration is working. Without an opportunity-side counterfactual, that reading is unsafe. The same observed rise can come from openness or from arithmetic, and the policy implications differ.
The poster paper upstairs is the methodological cousin of this one: same logic, different dimension, same insistence that opportunity be modelled before behaviour gets named.
The opportunity-versus-assortativity distinction is easier to feel than to explain. Three browser simulations make the lever visible. Adjust segregation, in-group attraction, and distance sensitivity, then watch couples form and see how much sorting emerges from each.
I'm a PhD candidate at the Institute for Analytical Sociology, Linköping University, defending in late 2026 and starting a Swedish Research Council postdoc in 2027. If you work on assortative mating, ethnic boundaries, segregation, or the methods used here, I'd like to talk.